EXPLAINER
SUMMARY
On February 4th, the Mail on Sunday and Daily Mail published an article (echoed by a number of other outlets since) proclaiming that world leaders have been “duped” by “manipulated global warming data”. The story is based on allegations (unconfirmed as of today) of disregarded data handling procedures in a 2015 study by Karl et al., which showed that the apparent warming slowdown in the early 2000s may have been partly attributable to data issues.
Scientists continue to discuss the finer points of the importance and causes of the slowdown, but they do understand that this temporary slowdown did not change the fact that the long-term warming trend caused by human activities is continuing apace.
We asked scientists to explain the Daily Mail article’s overall claim—that world leaders’ understanding of global warming depends on the validity of the Karl et al. paper. The scientists explained that the article exaggerates the impact of the Karl et al. paper, which showed only minor changes to the global temperature estimates of recent years. The Daily Mail article also fails to provide evidence for the claim that the paper was rushed—a claim that both NOAA and Science have rejected.
Critically, the Daily Mail article fails to recognize that the global temperature record in the Karl et al. paper agrees closely with every other major record of surface temperatures, and that the findings in the paper have been verified by other research.
This is part of a series of reviews of 2017’s most popular climate stories on social media.
UPDATE (7 Feb. 2017): While the Daily Mail article includes serious allegations of “data manipulation”, Dr. Bates (the “whistleblower”) contradicted the statements in the Daily Mail in a pair of new interviews on Tuesday. Bates told EENews, “The issue here is not an issue of tampering with data, but rather really of timing of a release of a paper that had not properly disclosed everything it was.” And in an interview with the Associated Press, Bates said there was “no data tampering, no data changing, nothing malicious.”
UPDATE (17 Sept. 2017): The Independent Press Standards Organization (IPSO) has ruled in favor of a complaint submitted against this article in the Mail on Sunday and Daily Mail. A description of the ruling, which states that the Mail article included “significantly misleading statements”, has been published in the Mail on Sunday and now appears atop the story on the Daily Mail website. Although IPSO has declined to require corrections to other stories that spread misinformation about climate change—such as an article in The Spectator on ocean acidification that was analyzed by Climate Feedback—IPSO found that David Rose’s article made unsupported claims that went far beyond Dr. Bates comments quoted in the story.
SCIENTISTS’ OVERALL FEEDBACK
Zeke Hausfather, Director of Climate and Energy, The Breakthrough Institute:
The “astonishing evidence” that David Rose purports to reveal in no way changes our understanding of modern warming or our best estimates of recent rates of warming. It does not in any way change the evidence that policymakers have at their disposal when deciding how to address the threats posed by climate change.
If anything, there is strong independent evidence that NOAA’s new record may be the most accurate one over the last two decades, at least for the two-thirds of the world covered in ocean. (Read more…)
Timothy Osborn, Professor, University of East Anglia, and Director of Research, Climatic Research Unit:
My overall take on the article is that it is misleading and inaccurate.
The headline’s claim that the Karl et al. paper “duped” world leaders into investing billions is utterly false. Leaving aside the question of whether the Karl et al. paper is invalid (it isn’t), the improvement to global temperature records reported by Karl et al. had only a small impact* on our estimate of global warming over the last century or more. It is this warming over the last 50 to 150 years that is most relevant for assessing the influence of greenhouse gases and particularly our emissions of CO2. These long-term warming trends (hardly affected by the Karl et al. paper) demonstrate the warming induced by CO2 and other greenhouse gases and provide (part of) the scientific basis for international climate agreements, like the one agreed by world leaders in Paris in 2015.
*A quote from Karl et al. (2015) supports this: “For the full period of record (1880–present) (Fig. 2), the new global analysis has essentially the same rate of warming as that of the previous analysis (0.068°C/decade and 0.065°C/decade, respectively)”.
Peter Thorne, Professor, Maynooth University:
Would Karl et al not having appeared make any material difference to our understanding of climate change? No. We have multiple indicators of a warming world (see e.g. IPCC WG1 AR5 FAQ 2.1). Also, Karl et al. sits nicely within the range of available surface temperature estimates, which includes several independent analyses and several dynamical reanalysis products. Removing the estimate wouldn’t even modify the range of available estimates to the community. So, on several grounds it’s not as important as it’s made out to be by those wishing to discredit it. That’s not to say it wasn’t important. Just that whether it existed or not wouldn’t make a difference to the biggest picture.
Victor Venema, Scientist, University of Bonn, Germany:
Many lines of evidence show that the Earth will warm about 3°C for a doubling of the CO2 concentration. This comes from basic physics, climate variations in various periods in the deep past, numerical climate models, the response of the climate to volcanic eruptions, and simple statistical models tuned to the instrumental warming. Any of these lines of evidence could be removed without changing the scientific assessment of future warming.
Since the 19th century we have seen about 1 °C (1.8 °F) of warming. The adjustments of Karl and colleagues (2015) are only of a few hundredths of a degree Celsius and thus do not appreciably change the scientific estimates of the climate sensitivity. The largest adjustment is actually making past sea surface temperatures warmer because old bucket measurements have a known cool bias (which actually reduces the magnitude of the warming trend). That adjustment is important for the assessment of climate sensitivity using only instrumental data.
Apart from the NOAA dataset we have two other US global temperature datasets, two mostly British, a Japanese and (soon) a Chinese one. Everyone can make the computation themselves, as all the data are freely available. These datasets use sea surface temperatures from NOAA, the UK Met Office, or the Japan Meteorological Agency. Any one of these datasets could be missing and it would not change our assessment of the warming.
KEY TAKE-AWAYS
The statements quoted below are from the Daily Mail article; comments and replies are from the reviewers.
“Because of NOAA’s failure to ‘archive’ data used in the paper, its results can never be verified.”
Zeke Hausfather, Director of Climate and Energy, The Breakthrough Institute:
Rose’s claim that NOAA’s results “can never be verified” is patently incorrect, as we just published a paper independently verifying the most important part of NOAA’s results.
I recently led a team of researchers that evaluated NOAA’s updates to their ocean temperature record. In a paper* published last month in the journal Science Advances, we compared the old NOAA record and the new NOAA record to independent instrumentally homogenous records created from buoys, satellite radiometers, and Argo floats. Our results, as you can see in the chart below, show that the new NOAA record agrees quite well with all of these, while the old NOAA record shows much less warming.
The new NOAA temperature record is by no means an outlier when compared to other groups producing global (land and ocean) surface temperature records. It shows less warming in recent years than records from Berkeley Earth, NASA, and Cowtan and Way, and a bit more warming than found in the Hadley Centre/CRU record. The old NOAA record, on the other hand, was on the bottom of the pack, with less warming than found by the other groups.
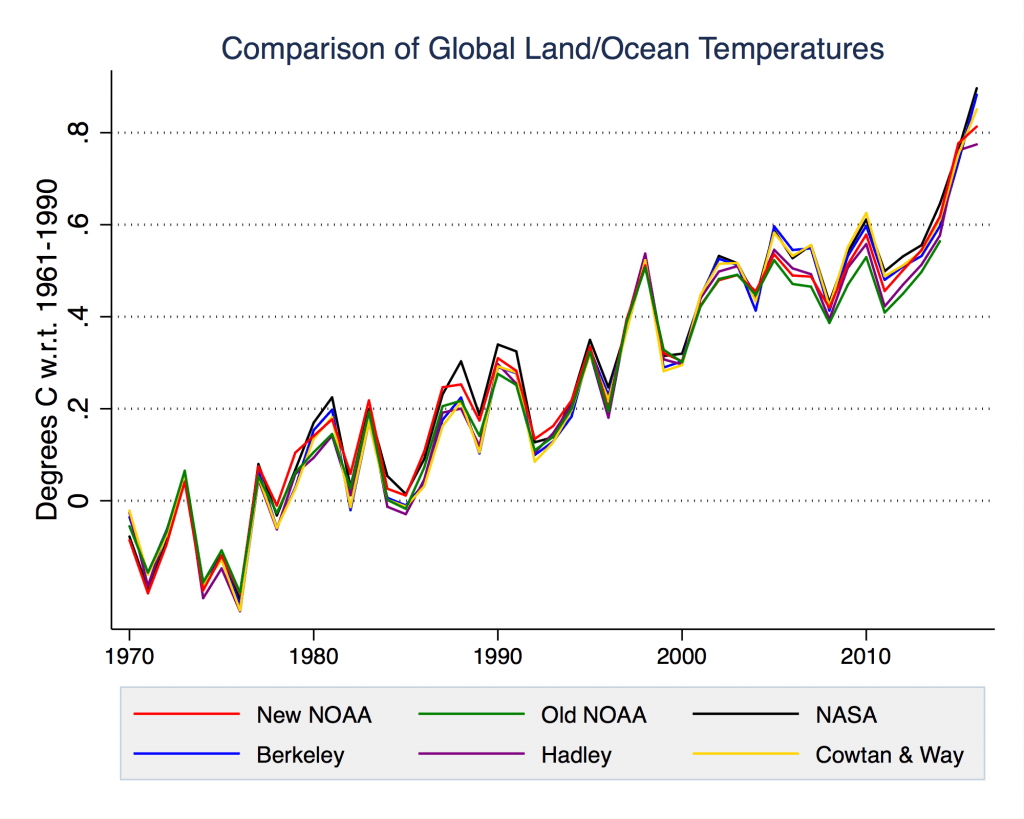
Figure: Global land/ocean temperature records from NOAA, NASA, Berkeley Earth, Hadley/UAE, and Cowtan and Way. Note that the old (pre-Karl et al.) NOAA temperature record is only available through the end of 2014.
- Hausfather et al (2017) Assessing recent warming using instrumentally homogeneous sea surface temperature records, Science Advances
Victor Venema, Scientist, University of Bonn, Germany:
A recommendable overview paper by Philip Jones* analyzed the new NOAA dataset. The results for land are shown below. The new ISTI raw data dataset shows more warming than the previous NOAA raw data dataset. As a consequence the homogenization now does not change the global mean appreciably any more to arrive at about the same answer after homogenization; compare NOAA uncorrected (yellow line) with NOAA (red; homogenized).
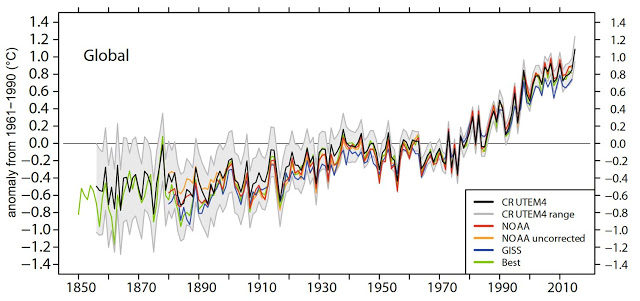
- Jones (2016) The Reliability of Global and Hemispheric Surface Temperature Records, Advances in Atmospheric Sciences
“The Karl study used flawed data, was rushed to publication in an effort to support the President’s climate change agenda”
Jeremy Berg, Editor of Science:
With regard to the “rush” to publish, as of 2013, the median time from submission to online publication by Science was 109 days, or less than four months. The article by Karl et al. underwent handling and review for almost six months. Any suggestion that the review of this paper was “rushed” is baseless and without merit. Science stands behind its handling of this paper, which underwent particularly rigorous peer review. (Source)
“a landmark paper that exaggerated global warming”
Victor Venema, Scientist, University of Bonn, Germany:
The thick black line shows the new assessment (ERSST.v4) and the thin red line the previously estimated global temperature signal (ERSST.v3). Differences are mostly less than 0.05°C, both warmer and cooler. The [exaggeration] is the minute change at the right end of the curves.
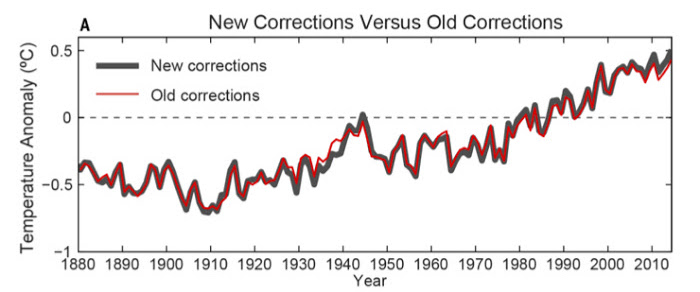
Source: Karl et al.. (2015)
“Dr Bates revealed that the failure to archive and make available fully documented data not only violated NOAA rules, but also those set down by Science.”
Zeke Hausfather, Director of Climate and Energy, The Breakthrough Institute:
David Rose relies on reports from a researcher at NOAA who was unhappy about the data archiving associated with the Karl et al paper. While I cannot speak to how well the authors followed internal protocols, they did release their temperature anomalies, spatially gridded data land and ocean data, and the land station data associated with their analysis. They put all of this up on NOAA’s FTP site in early June 2015, at the time that the Karl et al paper was published.
As someone who works on and develops surface temperature records, the data they provided would be sufficient for me to examine their analysis in detail and see how it compared to other groups. In fact, I used the data they provided shortly after the paper was published to do just that.
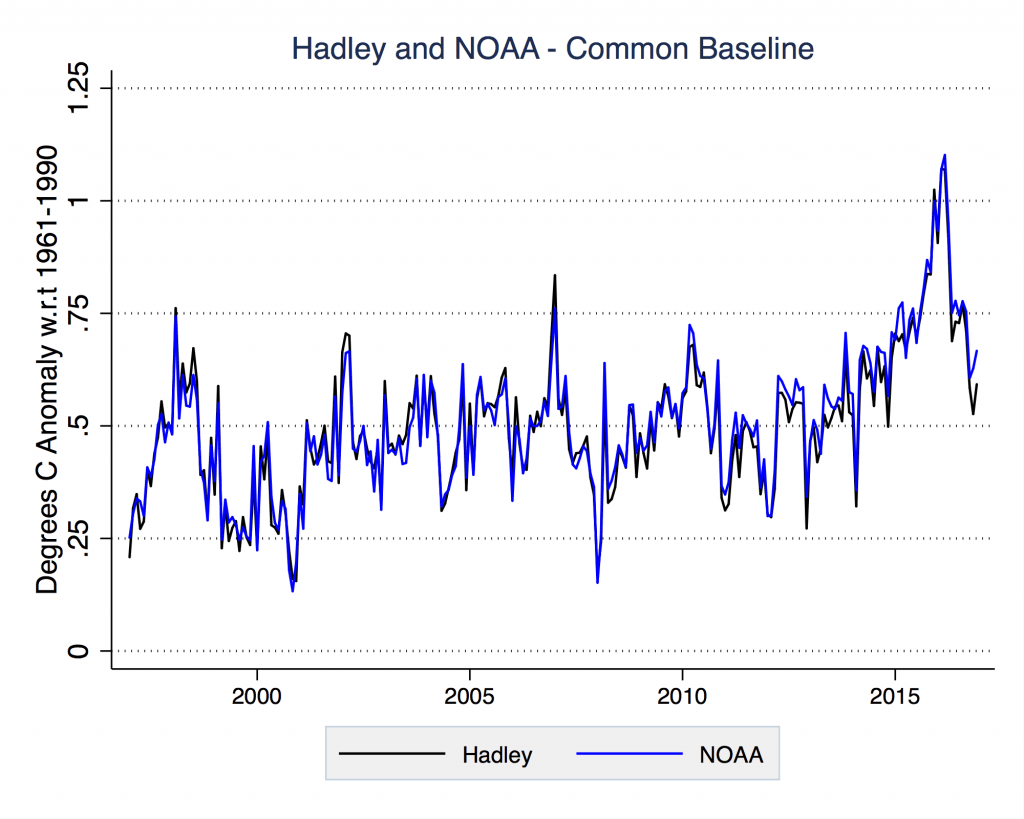
“The red line shows the current NOAA world temperature graph – elevated in recent years due to the ‘adjusted’ sea data. The blue line is the Met Office’s independent HadCRUT4 record.”
Zeke Hausfather, Director of Climate and Energy, The Breakthrough Institute:
Rose’s article presents a deeply misleading graph where he shows an arbitrary offset between NOAA’s data and the Hadley land/ocean dataset. This is an artefact of the use of different baselines; Hadley’s “0 °C” value is relative to the average temperature from 1961-1990, while NOAA’s is relative to the average temperature from 1901-2000 (a period which includes the colder early 20th century).
This comparison ends up being spurious, because each record uses a different baseline period to define their temperature anomaly. As the chart below shows, when you correctly put the two datasets on the same baseline (e.g. with respect to the 1961-1990 period), you find no offset in recent years between the two.
“NOAA has now decided the sea dataset will have to be replaced and revised just 18 months after it was issued, because it used unreliable methods which overstated the speed of warming”
Peter Thorne, Professor, Maynooth University:
While a new version of ERSST is forthcoming the reasoning is incorrect here. The new version arises because NOAA and all other centres looking at SST records are continuously looking to develop and refine their datasets. The ERSSTv4 development completed in 2013 so the new version reflects over 3 years of continued development and refinement. All datasets I have ever worked upon have undergone version increments. Measuring in the environment is a tough proposition – it’s not a repeatable lab experiment – and measurements were never made for climate. It is important that we continue to strive for better understanding and the best possible analyses of the imperfect measurements. That means being open to new, improved, analyses. The ERSSTv4 analysis was a demonstrable improvement on the prior version and the same shall be true in going to the next version once it also has cleared both peer-review and the NOAA internal process review checks (as its predecessor did).
“The land temperature dataset used by the study was afflicted by devastating bugs in its software that rendered its findings unstable”
Peter Thorne, Professor, Maynooth University:
The land data homogenisation software is publicly available and all known bugs have been identified and their impacts documented. There is a degree of flutter in daily updates. But this does not arise from software issues (running the software multiple times on a static data source on the same computer yields bit repeatability). Rather it reflects the impacts of data additions as the algorithm homogenises all stations to look like the most recent segment. The PHA algorithm has been used by several other groups outside NOAA who did not find any devastating bugs. Any bugs reported during my time at NOAA were investigated, fixed and their impacts reported.
“They had good data from buoys. And they threw it out […]”
Peter Thorne, Professor, Maynooth University:
The version (v4) actually makes preferential use of buoys over ships (they are weighted almost 7 times in favour) as documented in the ERSSTv4 paper. The assertion that buoy data were thrown away as made in the article is demonstrably incorrect.
“they had used a ‘highly experimental early run’ of a programme that tried to combine two previously separate sets of records”
Peter Thorne, Professor, Maynooth University:
Karl et al used as the land basis the ISTI databank. This databank combined in excess of 50 unique underlying sources into an amalgamated set of holdings. The code used to perform the merge was publically available, the method published, and internally approved. This statement therefore is demonstrably false.