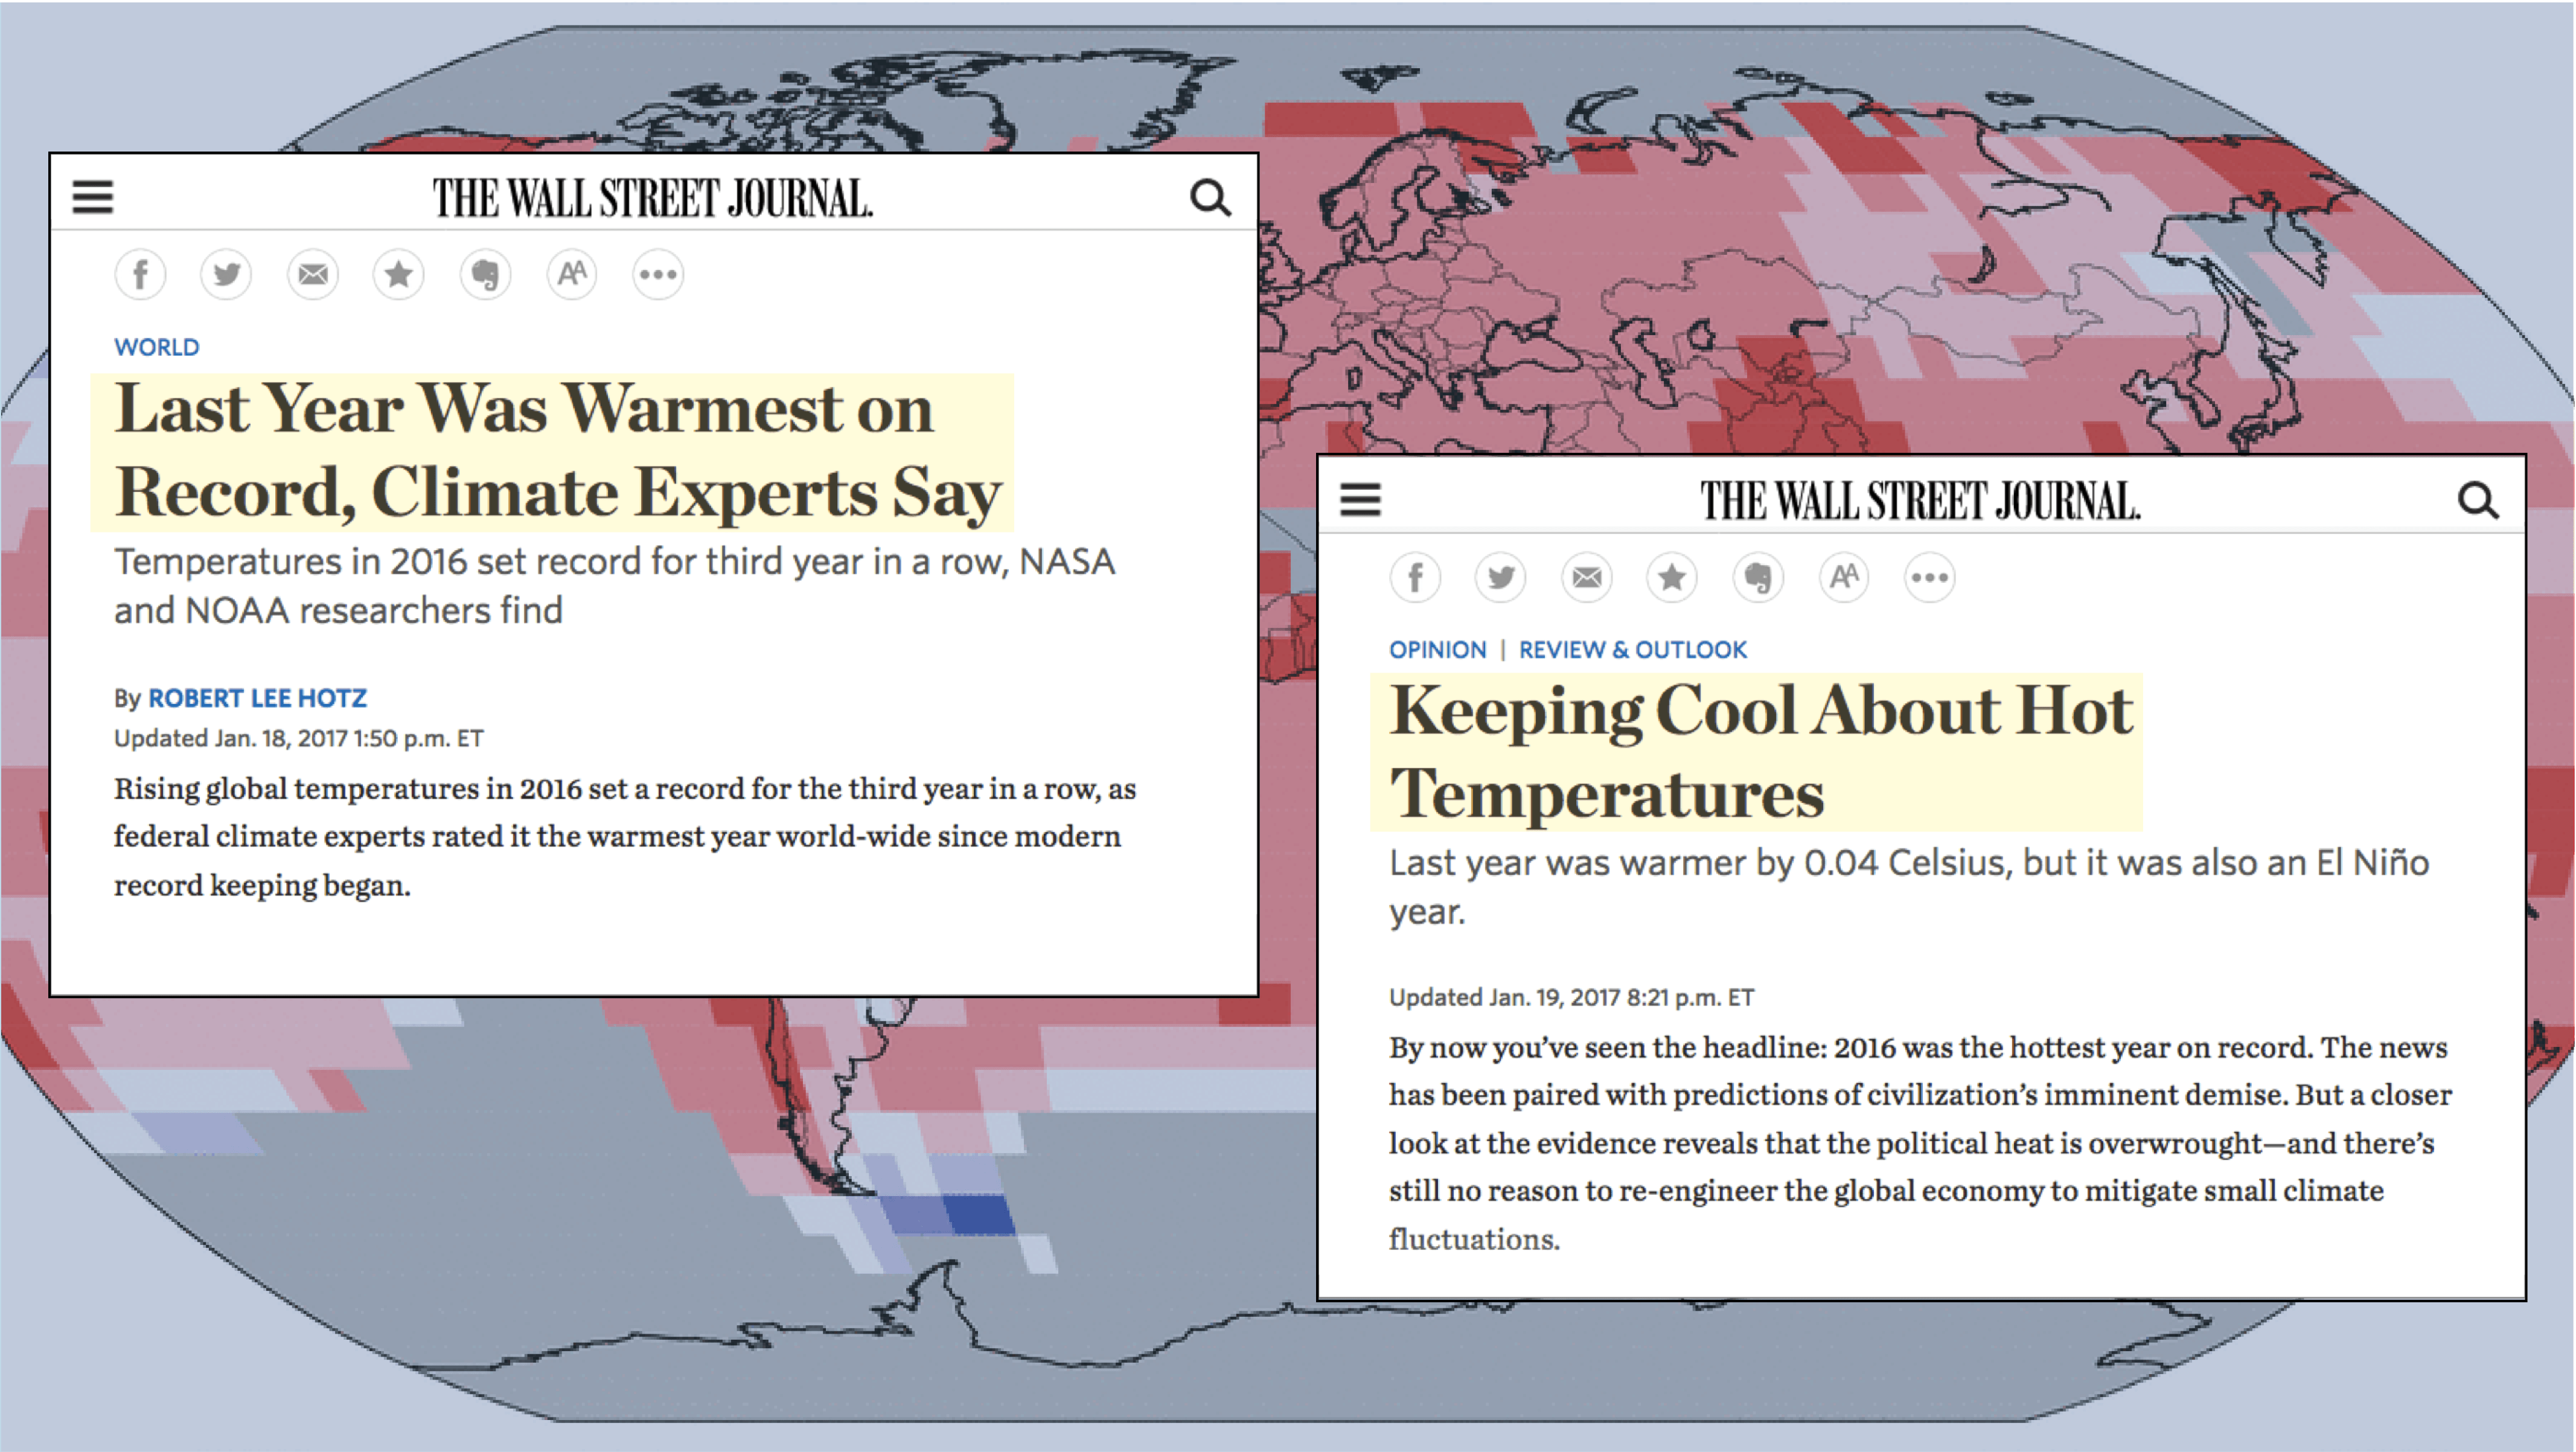
On January 18, NASA and NOAA released the data showing that 2016 was the warmest year on record in both datasets. All other major global surface temperature datasets, including the UK Met Office, Japanese Meteorological Agency, and Berkeley Earth datasets, indicated a new record, as well. The Wall Street Journal reported this news in a story by science journalist Robert Lee Hotz headlined “Last Year Was Warmest on Record, Climate Experts Say”. But soon afterward, a Wall Street Journal editorial titled “Keeping Cool About Hot Temperatures” questioned whether a record had even been set, and minimized the significance of the observed warming trend.
We selected key claims from each of the two articles to be reviewed for accuracy (listed below).
The scientists who reviewed these claims found that the ‘news story’ was mostly accurate. It faithfully reported the NOAA and NASA rankings while adding accurate context on the contribution of El Niño to the record warming (claim 1).
In a paragraph comparing recent years to temperatures during the El Niño of 1997-1998, the article could be clearer about the relationship between short-term variations and the long-term warming trend, and exaggerates the significance of updates to some datasets in affirming the continuation of that long-term trend, but is still fairly accurate (claim 2 & 3).
[For another accurate article detailing the 2016 temperature announcement, check out coverage in The Washington Post.]
The ‘editorial’ article, however, bases its argument on inaccurate claims and selective reporting. Selecting only one of the global surface temperature datasets, it misrepresents the impact of error bars on record rankings. It inaccurately claims that “no one really knows if last year was a record” (claim 4). Last year is, indeed, ranked as the warmest year on record in each of the datasets.
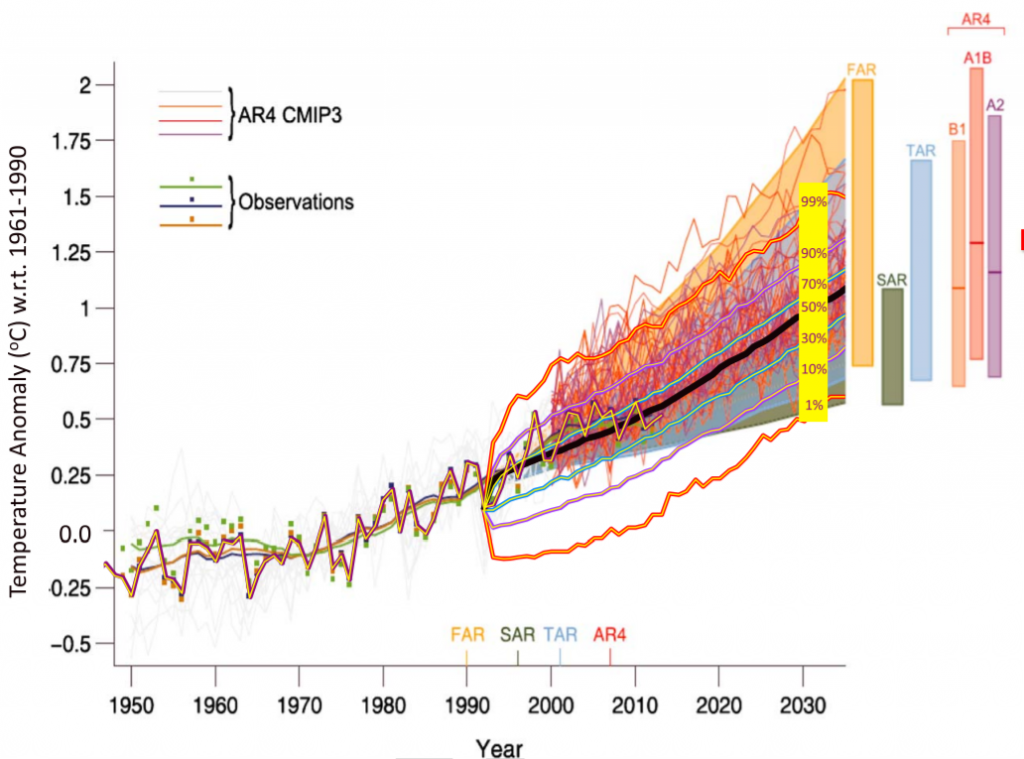
The editorial also claims that climate model projections have overestimated the warming trend (claim 5). As the scientists who reviewed this claim note, this is due partly to a misunderstanding of the impact of natural variability, partly to misrepresenting the warming rate predicted in the IPCC report, and partly to misrepresenting the observed warming rate in recent years.
Climate Feedback has now evaluated a number of articles appearing in the Op-Ed section of the Wall Street Journal that have misrepresented climate science, downplaying the documented impacts of climate change. In this case, the editorial fails to acknowledge the facts—and the understanding of the role of human-induced climate change in 2016’s record warmth—accurately reported in the paper’s own news story.
Last year, Forbes ran a similar set of contradictory articles. An opinion post we reviewed falsely claimed that 2015 failed to set a record for warmest year, while another article accurately reported the data showing that 2015 did indeed set a record. However the inaccurate article had been read 20 times more than the accurate one (as of Jan 27, 2017, according to Forbes statistics). While contradictory stories might seem to provide a sort of balance, this misunderstands what balance means in science—reporting the weight of evidence— and it leaves more readers confused rather than informed about reality.
SCIENTISTS’ FEEDBACK
Article 1 (news story): “Last year was warmest on record, climate experts say”
CLAIM 1: “Rising global temperatures in 2016 set a record for the third year in a row, as federal climate experts rated it the warmest year world-wide since modern record keeping began.”
Zeke Hausfather, Director of Climate and Energy, The Breakthrough Institute:
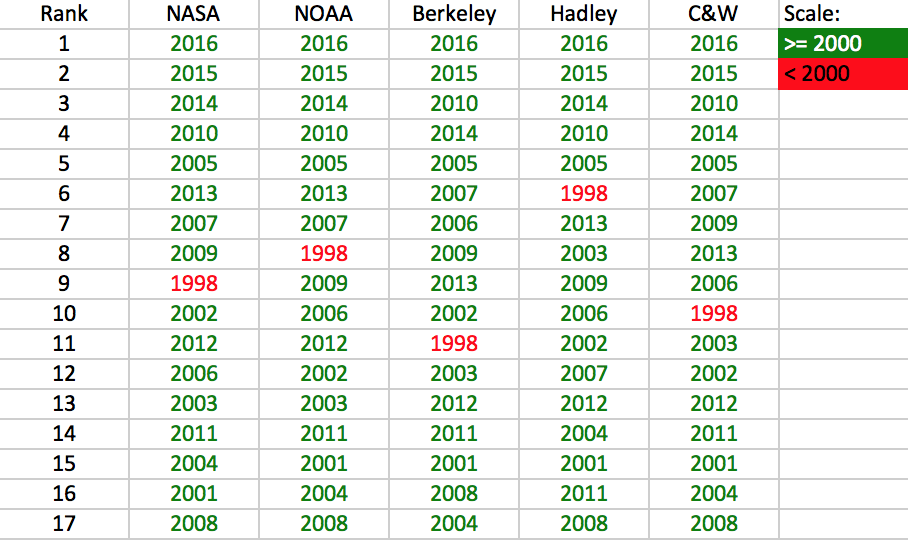
2016 did indeed set a record for the third year in a row for both U.S. surface temperature series (NASA and NOAA), as well as that of the UK’s Hadley Centre. It was only the second record in a row for the Berkeley Earth and Cowtan and Way series, which have 2010 slightly edging out 2014. In all five records 2010 and 2014 are effectively tied, so this slight difference in ordering does not reflect any fundamental disagreements. In all five series 15 out of the last 16 years were the warmest ever recorded:
CLAIM 2:“global land and sea surface temperatures were boosted by a powerful El Niño current in the Pacific and by rising concentrations of heat-trapping greenhouse gases in the atmosphere. During 2016, the average temperature across global land and ocean surfaces was 1.69°F (0.94°C) above the 20th-century average”
Zeke Hausfather, Director of Climate and Energy, The Breakthrough Institute:
This is accurate: depending on the analysis, scientists have found that El Niño added anywhere between 0.1 and 0.2 °C to 2016 temperatures, and a smaller amount to 2015 temperatures. However, when scientists use the same process to remove the effect of El Niño from all years, they still find that 2015 and 2016 were the two hottest years on record (though whether 2016 beats 2015 depends on the El-Niño corrected dataset’s Arctic coverage). For more details, see this blog post applying the methods from Foster and Rahmstorf.
CLAIM 3:“Some researchers have argued that the rise in global temperatures peaked during the very strong El Niño year of 1998 and has stalled since. NOAA scientists and other research groups, however, re-examined the data and reported in several studies over the past two years that the apparent slowdown was due to measurement errors that, when corrected, show that global temperatures have risen steadily.”
Zeke Hausfather, Director of Climate and Energy, The Breakthrough Institute:
This statement is reasonably accurate, though after the past three record years you would have difficulty finding researchers who think warming has stalled through present (some do still argue that the 1998-2012 period was anomalous). Measurement error played a role in the elimination of the apparent slowdown, as we discuss in Hausfather et al 2017, but the single largest factor was the temperatures of the prior three years.
Piers Forster, Professor, University of Leeds:
This is partly correct, I would say.
The rate of temperature rise has been slower over last 1.5 decades than in the 1990s, but as datasets of global temperature have been improved, there is less evidence for a real stalling of the temperature rise since 2000 (or 1998). Temperatures have risen steadily.
It’s not really down to measurement errors, though. The biggest factors in improving the datasets of global surface temperatures are in the way individual measurements are aggregated for making a globally averaged time series. These improvements come from better accounting for the considerable Arctic warming over recent decades, and more careful accounting for rates of warming differences in the surface layer of the ocean with the rates of warming at 2 meter altitude, used for compiling global surface temperature trends*.
- Hausfather et al (2017) Assessing recent warming using instrumentally homogeneous sea surface temperature records, Science Advances
Article 2 (Editorial): “Keeping cool about hot temperatures”
CLAIM 4:“2016 edged out 2015 by a mere 0.04 degrees Celsius. That’s a fraction of the margin of error. Atmospheric data from satellites detected similarly small warming over previous years. In other words, no one really knows if last year was a record.”
Zeke Hausfather, Director of Climate and Energy, The Breakthrough Institute:
This is selectively reporting only part of the story. While it is true that Hadley, NOAA, UAH(v6 beta), and RSS(v3) only showed a small warming over the previous record (2015 in the surface records, 1998 in the satellite records), the margin in the NASA, Berkeley Earth, Cowtan and Way, UAH(v5.6), and RSS(v4) was highly significant and clear, as shown in the figure below:
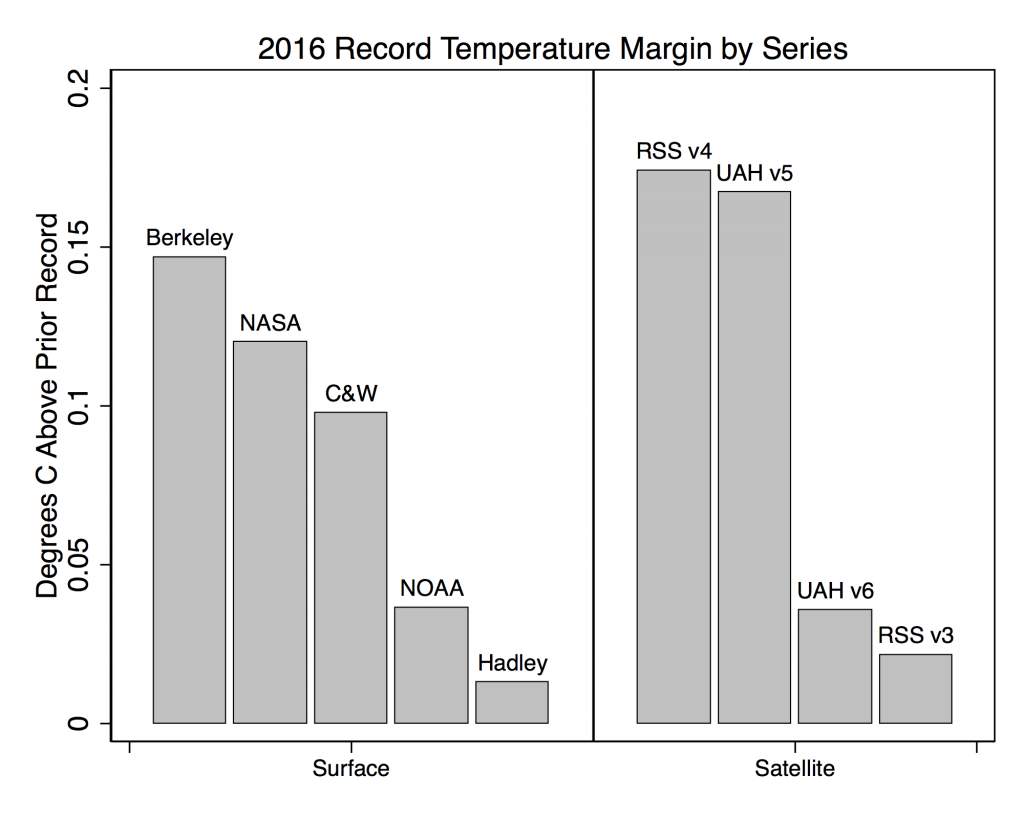
In five of the nine datasets we can clearly say it’s a record. In the other four it’s still more likely than not the warmest year on record.
Christopher Merchant, Professor, University of Reading and UK National Centre for Earth Observation:
It is correct to state that the amount by which the recorded global temperature of 2016 exceeds that of 2015 (0.04 °C) is within the margin of error (0.15 °C) that NOAA quote (table in [1]). One can correctly state that “no one really knows” in that sense. An alternative statement of the same facts is that there is a better-than-even chance that 2016 was warmer than 2015. Note that while 2016 exceeds 2015 by an amount that is statistically small, years previous to 2015 were significantly cooler. For example, the year of the warm temperature “spike” in 1998 [2] discussed later in the article was recorded as 0.27 °C cooler than 2015, which illustrates the trend to warmer temperatures underlying the year-to-year fluctuations.
- [1] NOAA National Centers for Environmental Information, State of the Climate: Global Analysis for Annual 2016, http://www.ncdc.noaa.gov/sotc/global/201613
- [2] NOAA National Centers for Environmental information, Climate at a Glance: Global Time Series, http://www.ncdc.noaa.gov/cag/
CLAIM 5:“the warming is not nearly as great as the climate change computer models have predicted. […]U.N. Intergovernmental Panel on Climate Change simulations forecast surface temperatures to increase on average 0.2 degrees Celsius per decade in the early 21st century. The warming over the first 15 years was closer to 0.05 degrees Celsius.”
Zeke Hausfather, Director of Climate and Energy, The Breakthrough Institute:
Since the start of the 21st century, climate models predict 0.2 °C per decade surface warming. Observed surface warming over that same period has been 0.2 °C (NASA), 0.19 °C (NOAA) 0.18 °C (Berkeley/ Cowtan and Way), and 0.16 °C (Hadley). All of these are statistically indifferentiable from model projections over this period. In general, recent temperatures have been pretty close to the multi-model mean:
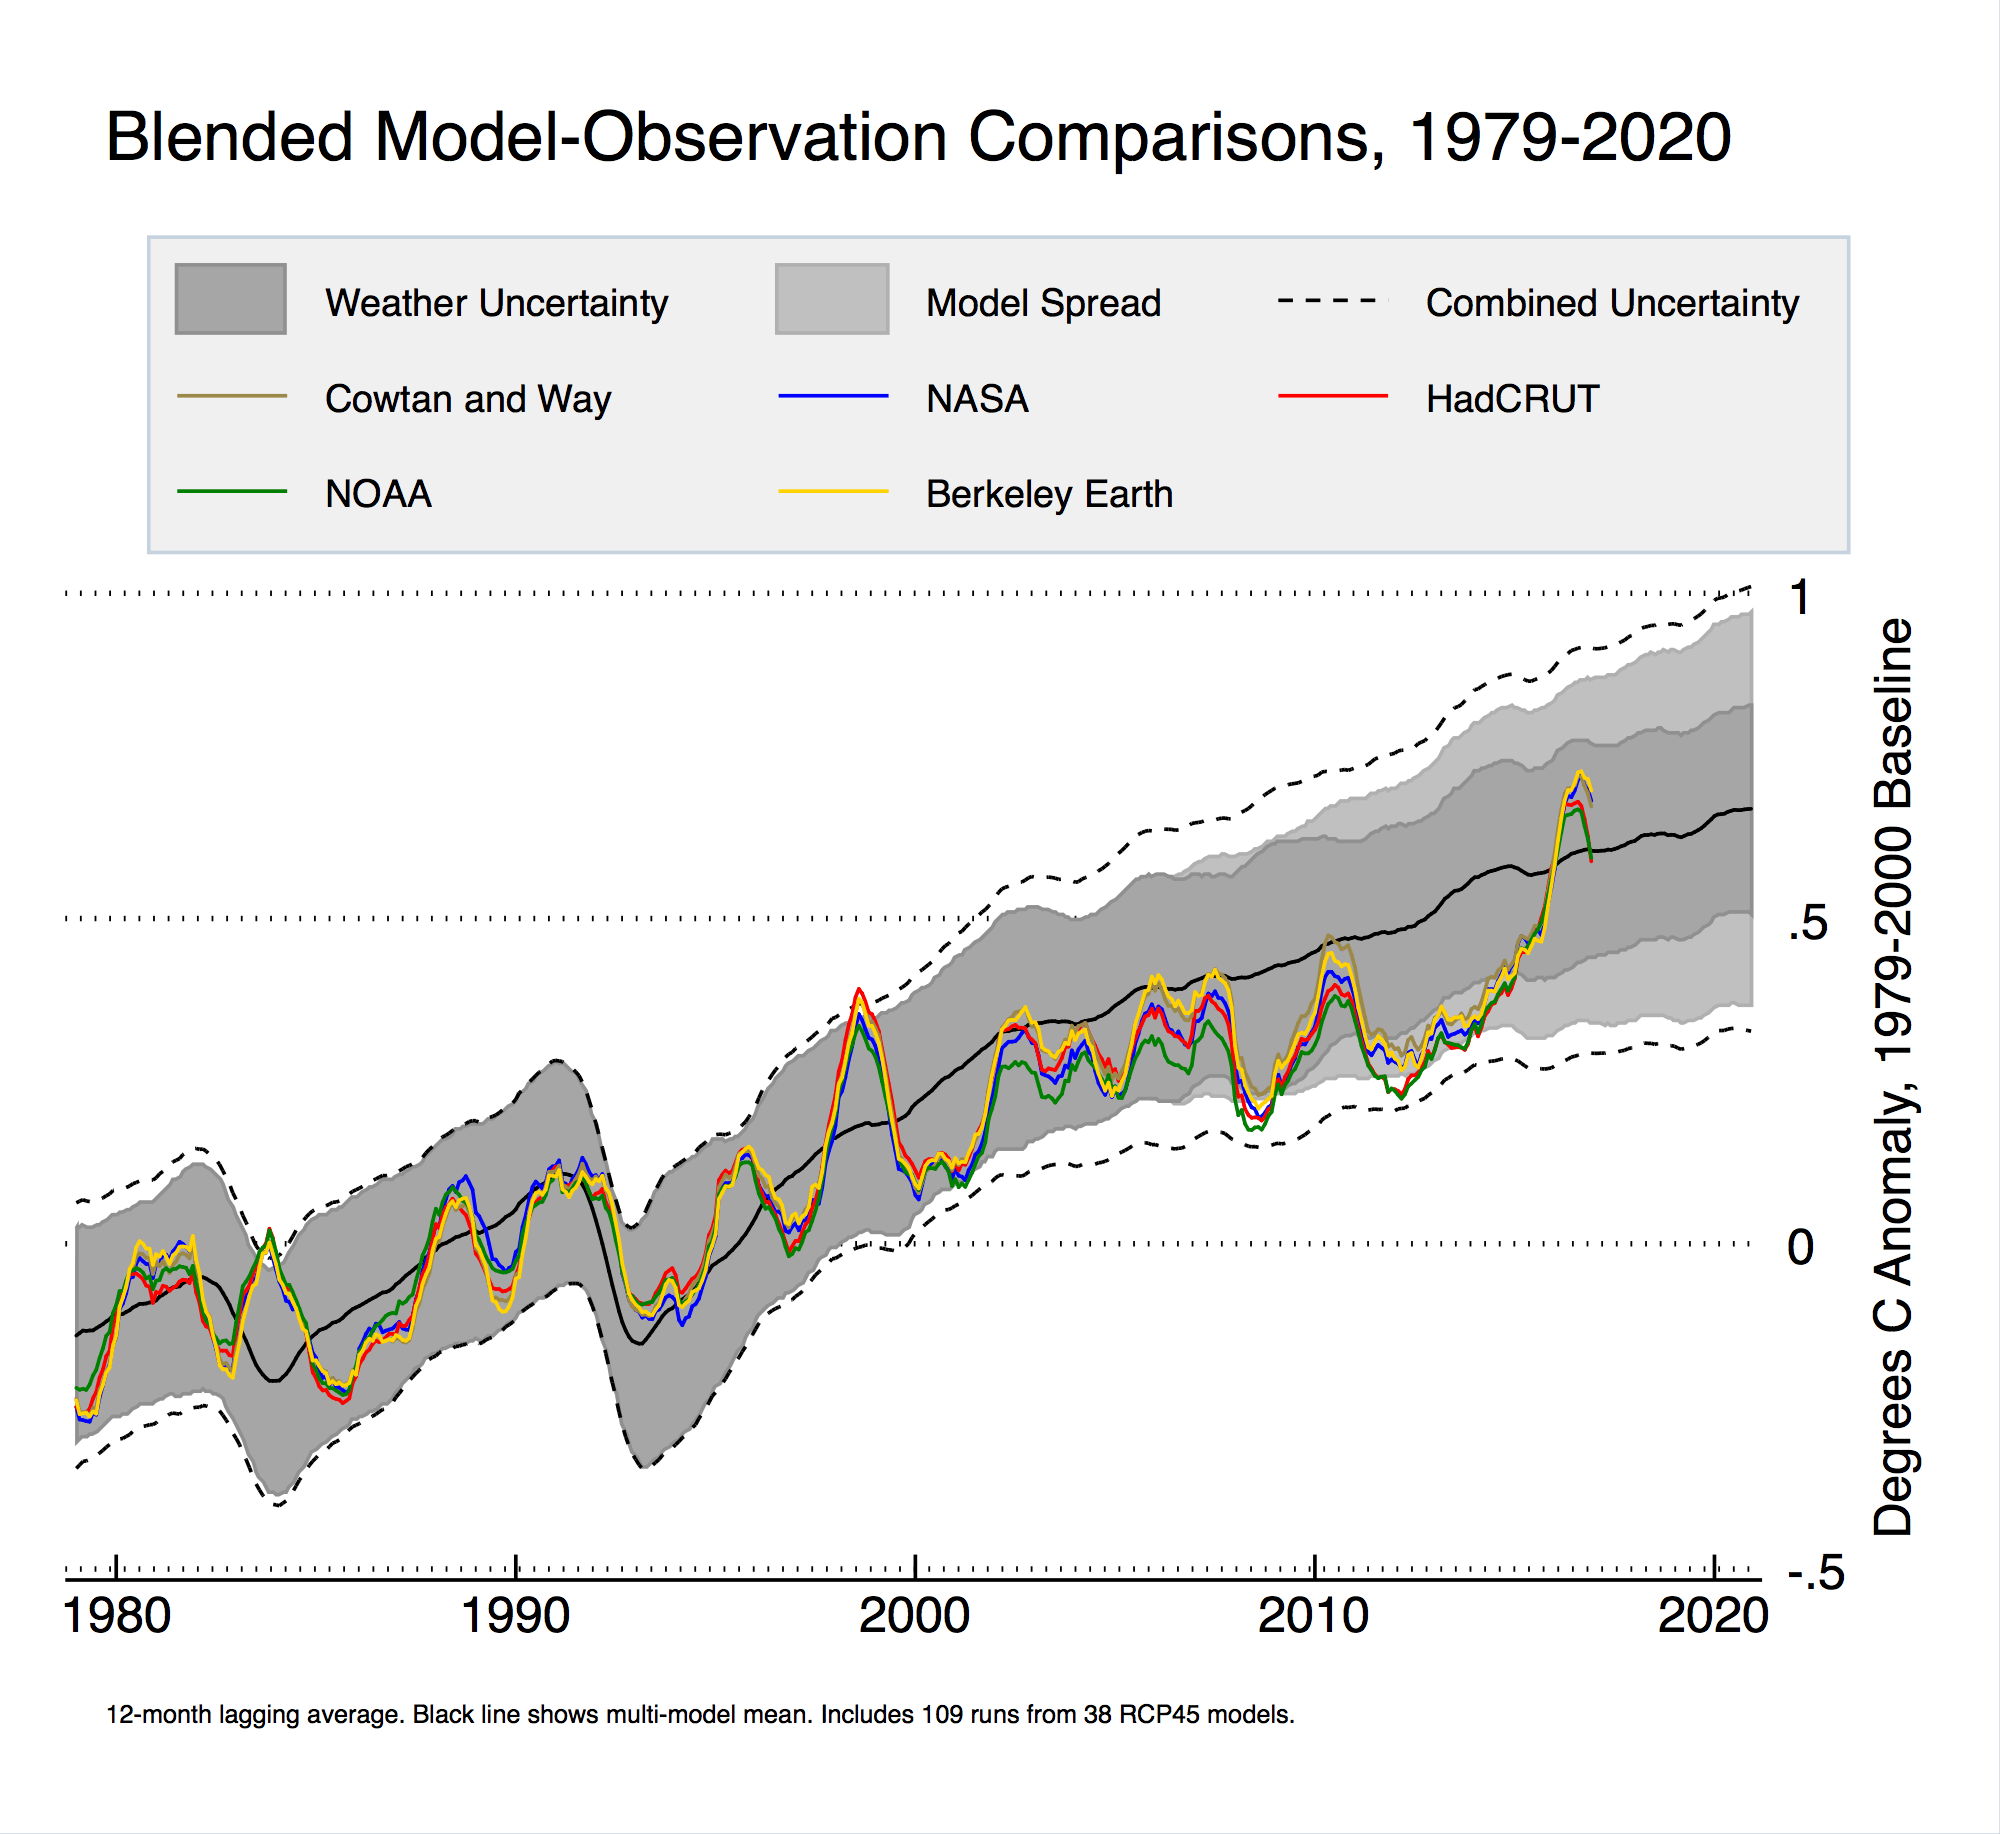
Model comparisons with satellite data are more difficult as satellites don’t measure the Earth’s surface temperature. Some satellite records (RSSv4, UAHv5.6) are in reasonable agreement with model projections for tropospheric temperatures between 2000 and present, while others (UAHv6 beta, RSSv3) are notably cooler.
Christopher Merchant, Professor, University of Reading and UK National Centre for Earth Observation:
Although climate modellers tend to quote the trend to warmer temperatures in units of “degrees per decade”, it is a misunderstanding to interpret that to mean that they expect every decade to have that trend. This is why in the quoted statement, the forecast is for increases to be “on average” 0.2 °C. Just as weather fluctuates from day to day, there are fluctuations between years and decades, too.
Shaun Lovejoy, Professor, McGill University:
The figure below from Lovejoy (2015)* gives some details, but the basic claim of 0.2 °C too high is essentially correct. However, as the figure shows, the temperature was accurately forecast (actually hindcast) to within 0.05 °C by using a stochastic (not General Circulation Model) modelling approach.
The stochastic approach worked well because the so-called pause (since 1998) was actually simply a return to the long-term (anthropogenically forced) trend that followed the massive pre-pause warming from 1992 to1998. The key point is that the fact that General Circulation Model’s tended to over-forecast the warming is a model and/or data problem (there are many different explanations in the literature), but this in no way alters the fact that the temperatures are almost exactly varying about the long term anthropogenic trend as expected.
- Lovejoy (2015) Using scaling for macroweather forecasting including the pause, Geophysical Research Letters
Piers Forster, Professor, University of Leeds:
The high emissions scenario (RCP8.5) model simulations did show around 0.2 °C warming per decade. But the IPCC report (Chapter 11, WG1, AR5, Fig 11.25) never relied on just these runs to make its prediction. It relied on multiple lines of evidence. Its temperature prediction was in fact around 0.05 to 0.15 C per decade.
The statement “the warming over the first 15 years is 0.05 °C per decade” is not correct. (This was probably meant to be degrees per decade from an old version of the HadCRUT dataset with limited coverage on the Arctic). The latest analysis and synthesis of the different records published in Science in January* constrains sea-surface temperatures trends over the last 19 years to between 0.07 and 0.12 °C per decade. Global temperatures have been rising slightly faster than this due to land surface warming more.
- Hausfather et al (2017) Assessing recent warming using instrumentally homogeneous sea surface temperature records, Science Advances