

Flawed Reasoning: Even if the US experienced a flat temperature change for 14 years, this would not prove that global warming isn't occurring. The US only covers a small portion of the planet, and a 14-year period is too short to reliably indicate long-term trends over short-term variability.

REVIEW
CLAIM: But a new, improved system to assess surface temperatures established in 2005 by the National Oceanic and Atmospheric Administration, NOAA, indicates otherwise. In fact, the U.S. Climate Reference Network -- comprised of 114 pristinely maintained temperature stations spaced relatively uniformly across the lower 48 states -- finds there has been no warming for the past 14 years at least [...] All of the asserted U.S. warming since 1930 is the product of the controversial adjustments made to the raw data.
This article at WND is based on a post by James Taylor at RealClearEnergy and an article at Power Line by John Hinderaker. The WND article, however, was the most widely shared of the three on social media.
Zeke Hausfather, Director of Climate and Energy, The Breakthrough Institute:USCRN is a state-of-the-art monitoring network that covers the contiguous US, with pristine-sited triple redundant thermometers sending data automatically via satellite uplinks in real time. It’s an incredibly valuable resource for us to ground-truth temperatures and provides a useful check on the effectiveness of our adjustments to the much-messier weather station network—which is subject to biases from station moves, instrument changes, time of observation changes, and changes in surrounding vegetation or urban form.
Since its inception, researchers have compared data from USCRN to the broader weather station network that constitutes our US historical temperature record. We have found that USCRN readings are nearly identical to the US-wide record from the weather station network; if anything, USCRN shows slightly more warming than the existing network (ClimDiv is the old network, USCRN is the new network):
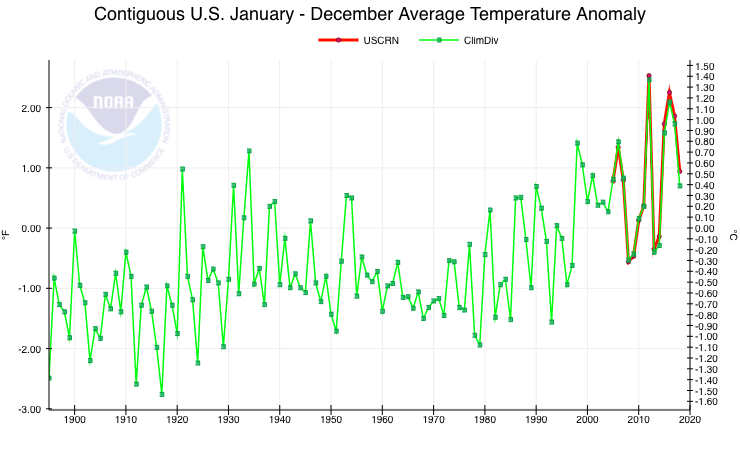
Since it achieved nationwide coverage at the start of 2005, the warming rate (trend) in USCRN annual temperatures is 0.86°F per decade, with uncertainties ranging from -0.58°F to 2.31°F per decade. By contrast, the historical NOAA ClimDiv dataset only shows 0.64°F (ranging from -0.80°F to 2.07°F) per decade. As this is a relatively short time period and only covers around 2% of the surface of the Earth, we shouldn’t read too much into these numbers as an indication of longer-term changes, but we can say that USCRN data is completely consistent with the long-term warming trend, and suggestions that the USCRN “finds there has been no warming for the past 14 years at least” are categorically false.
In 2016, I was the lead author on a paper in GRL1 that looked in detail at differences between USCRN and historical weather station networks. We found that not only did USCRN match the weather station network quite well over the full US, but when comparing pairs of nearby USCRN and historical weather stations, the adjustments made by NOAA to historical weather stations bring them into much closer agreement with USCRN stations. This is true even when USCRN stations are not used as part of the adjustment process:
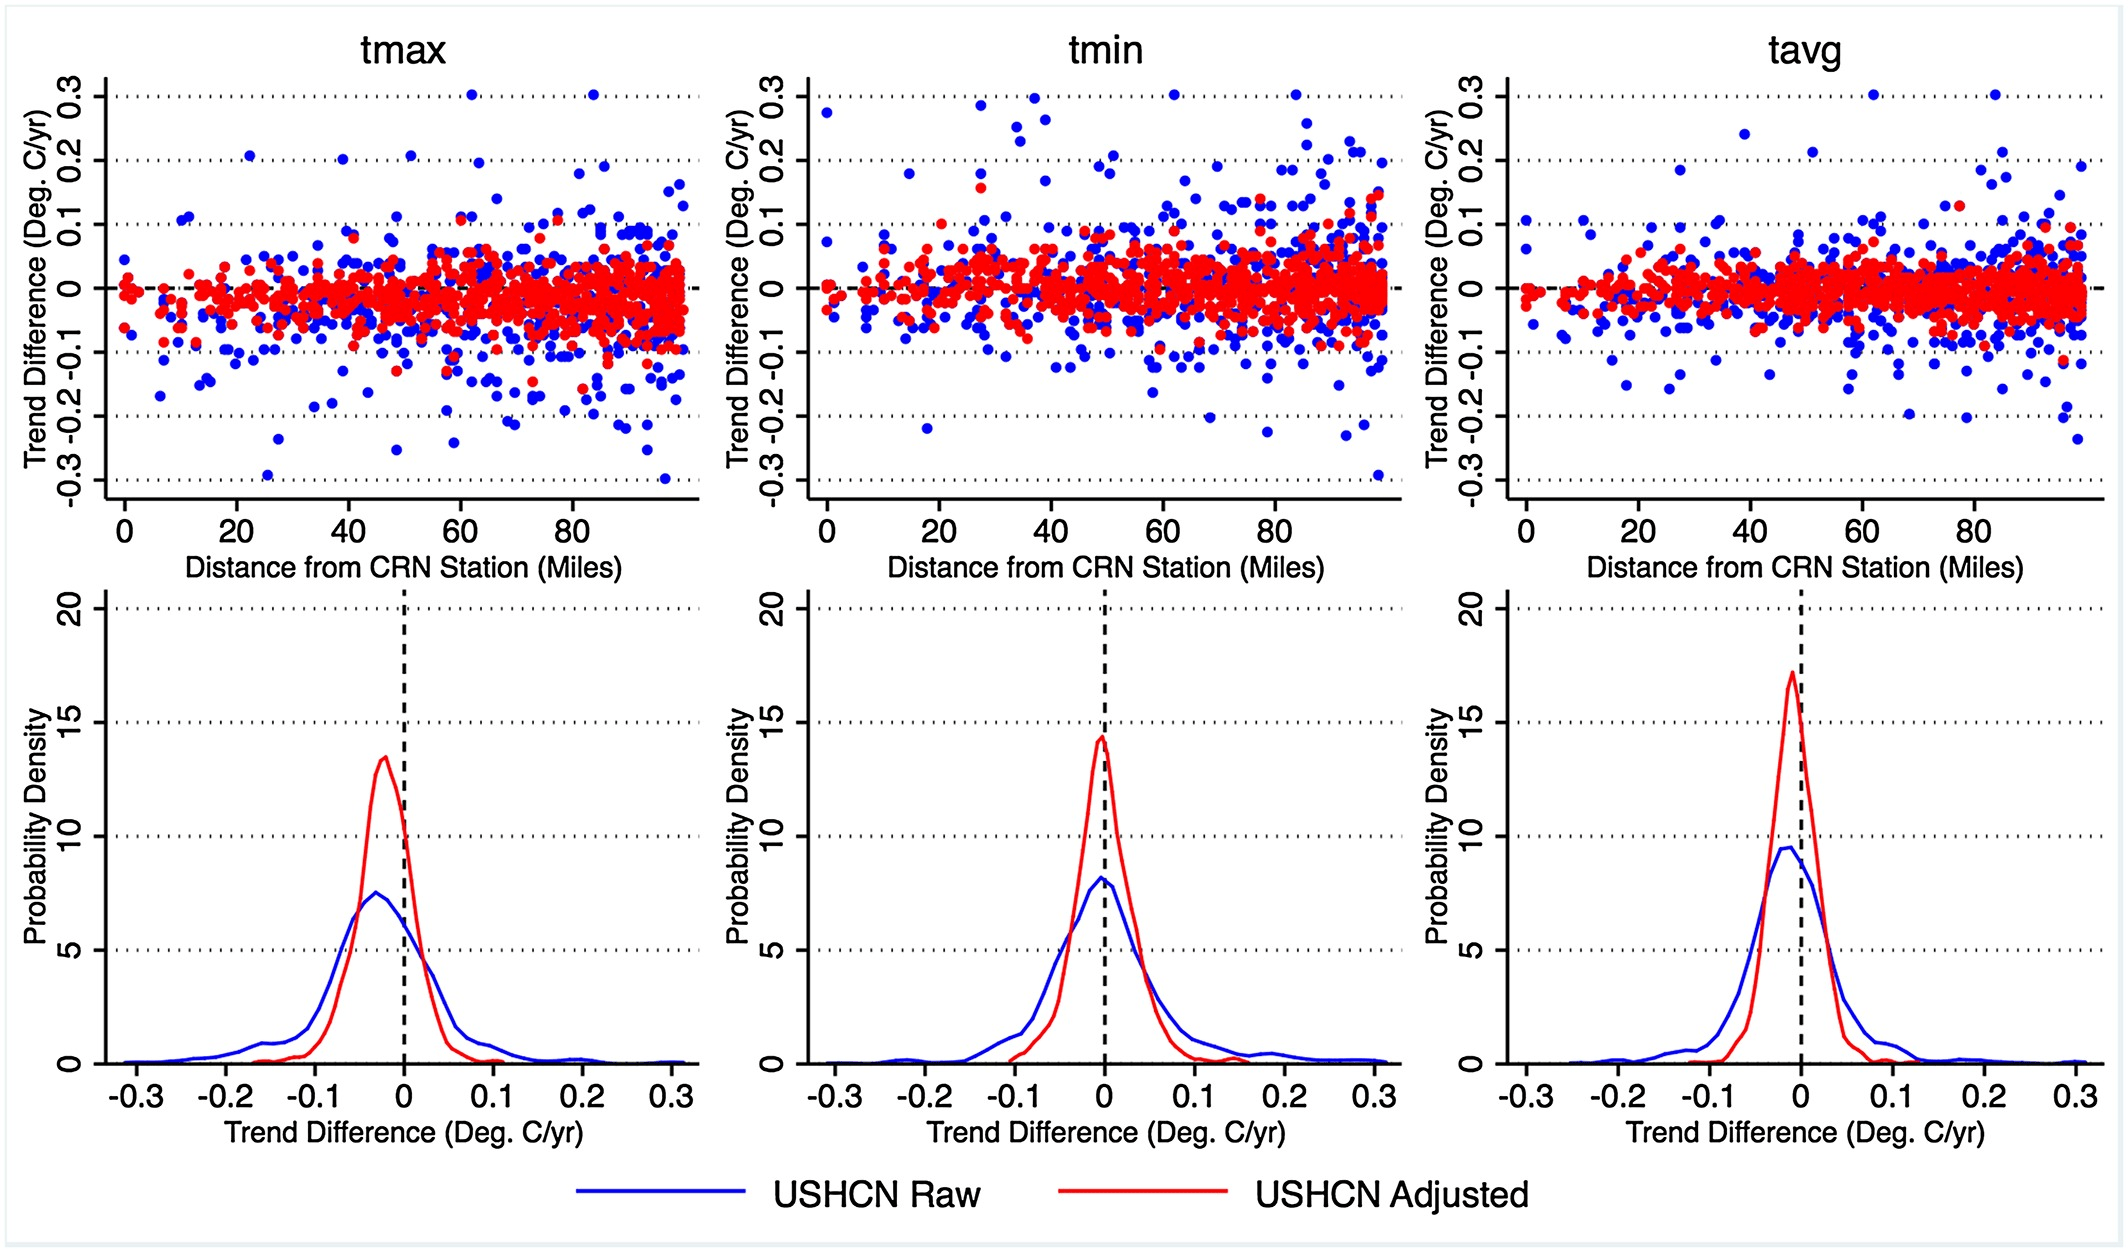
- 1- Hausfather et al (2016) Evaluating the impact of U.S. Historical Climatology Network homogenization using the U.S. Climate Reference Network, Geophysical Research Letters
Mark Richardson, Research Associate, Colorado State University/NASA JPL:
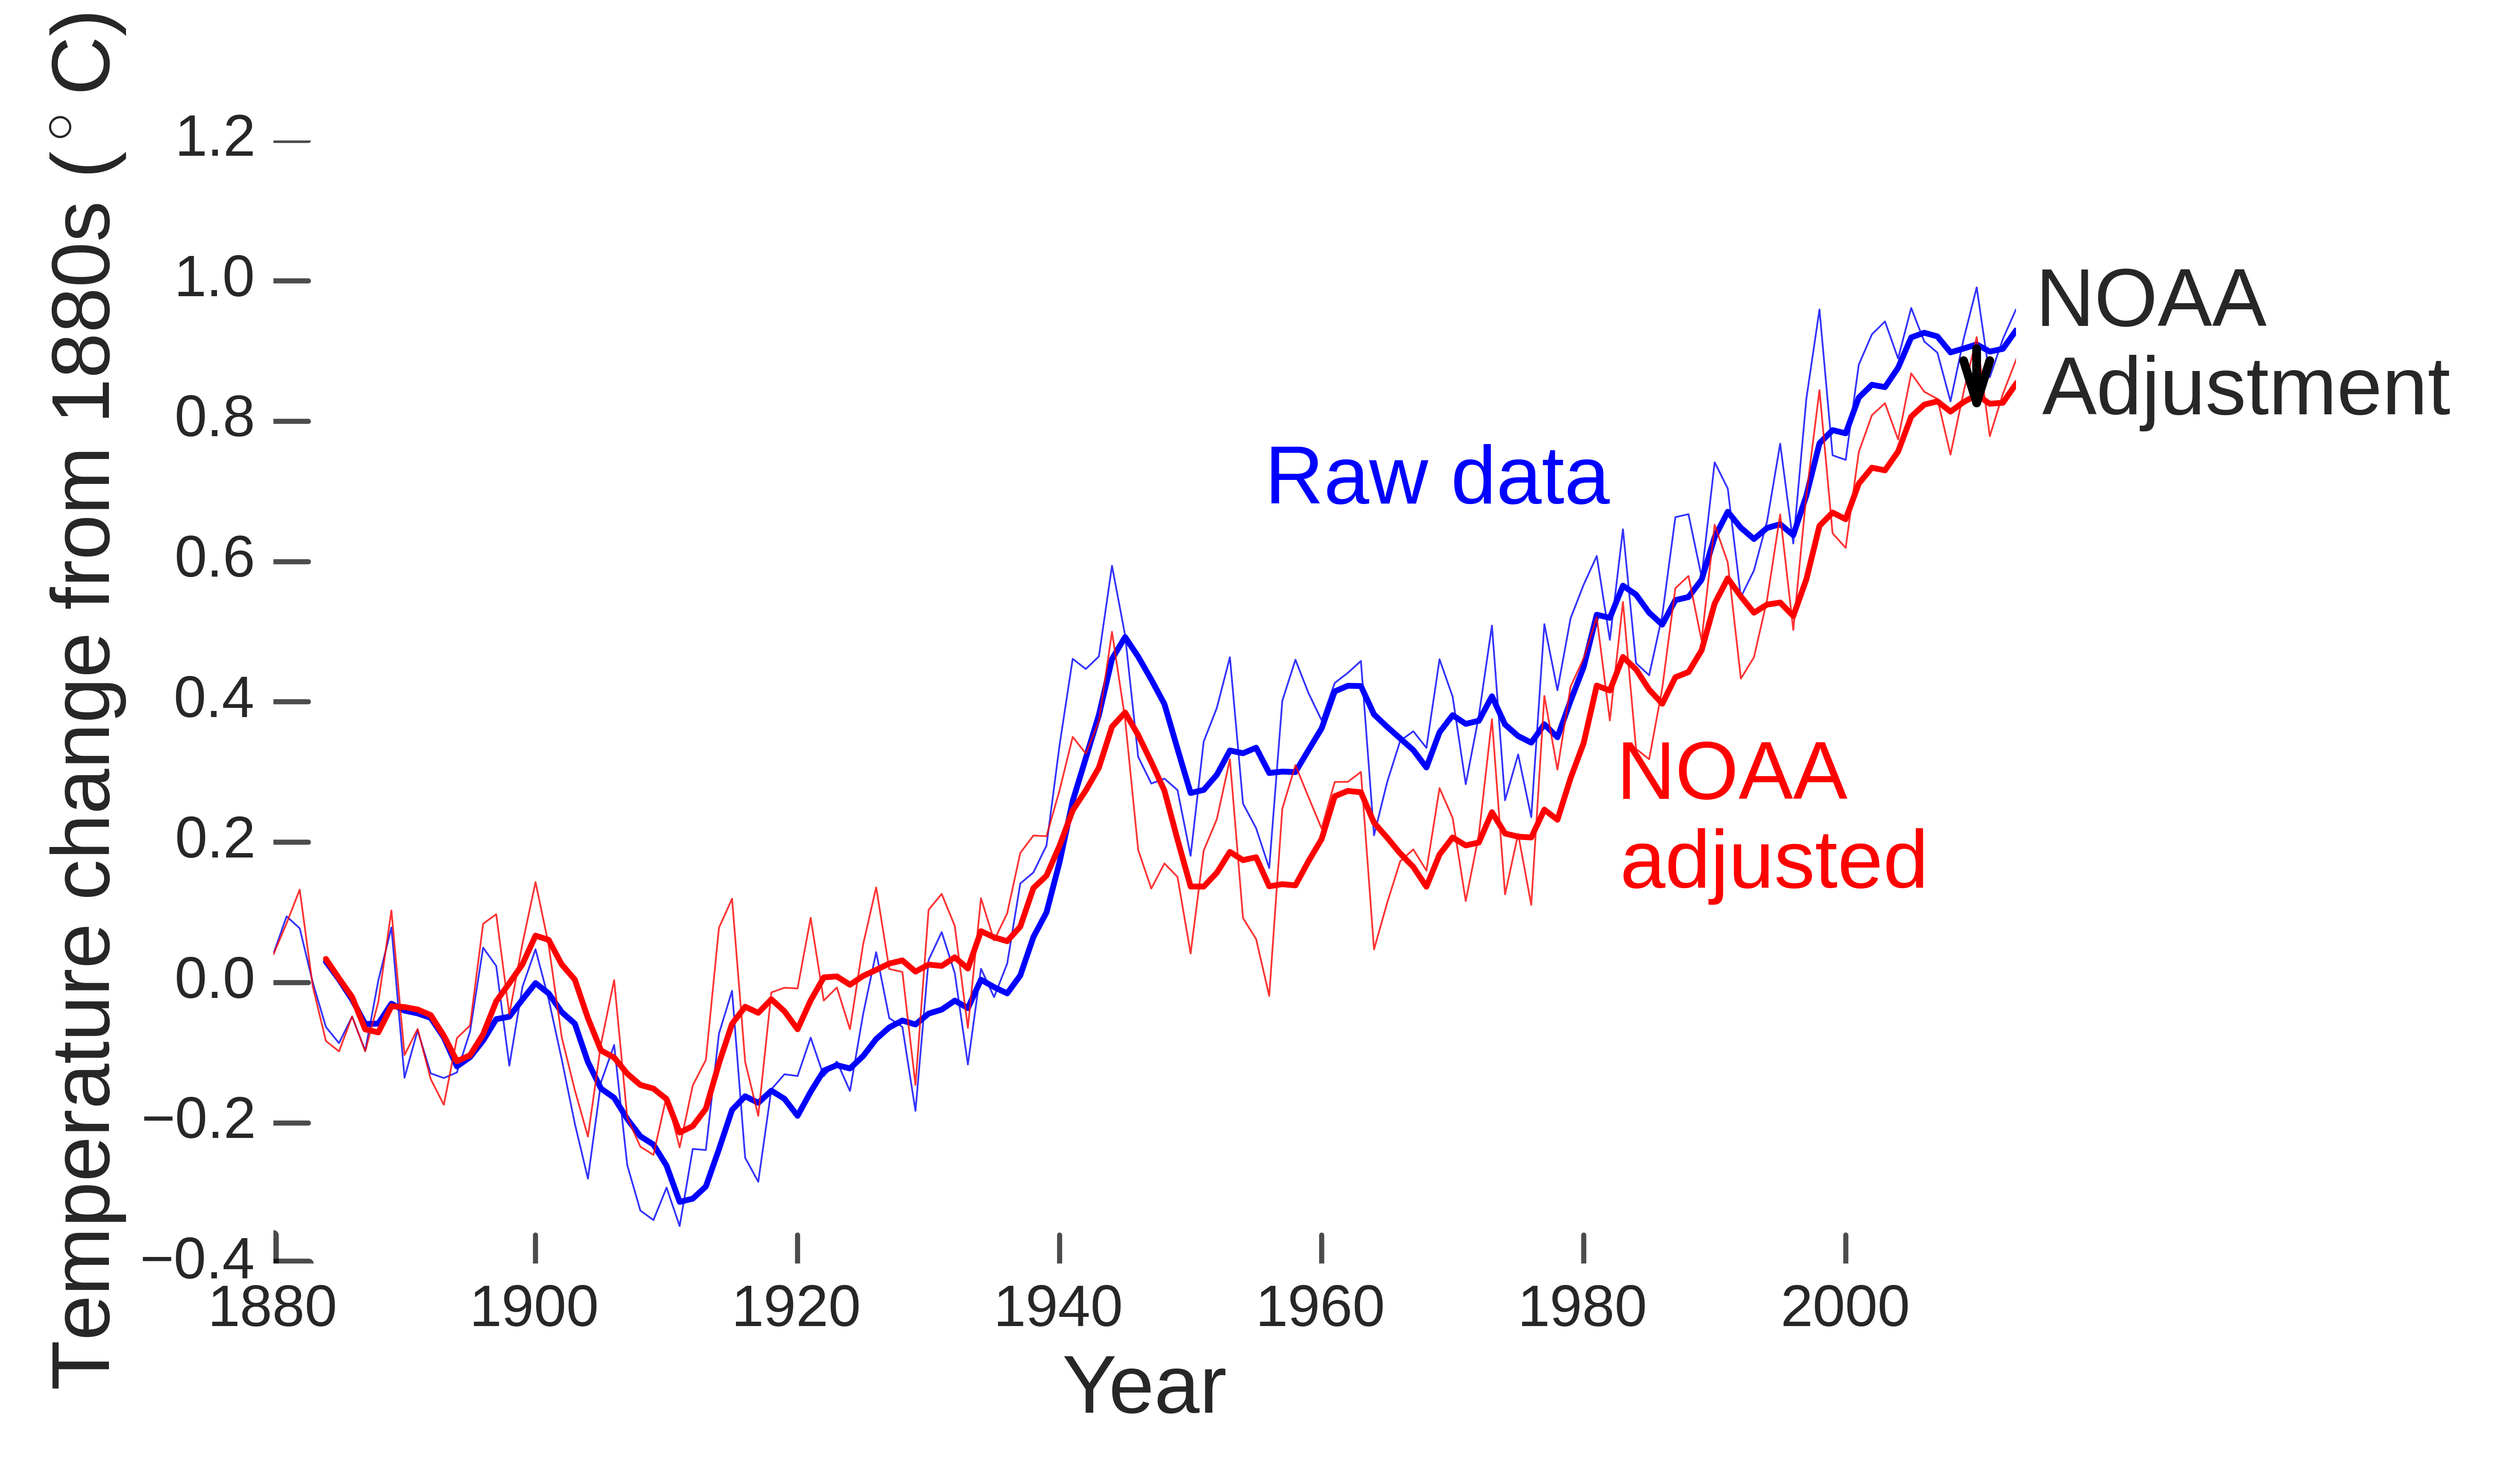
Raw data show more global warming since 1880 than is reported by NOAA [or shown in other datasets]. This is because NOAA “adjusts” temperature data to fairly compare different measurement times, places, and technologies. The cooling effect of adjustments on global temperatures has been shown lots of times, such as with the graph below for 1880—2013 temperatures.
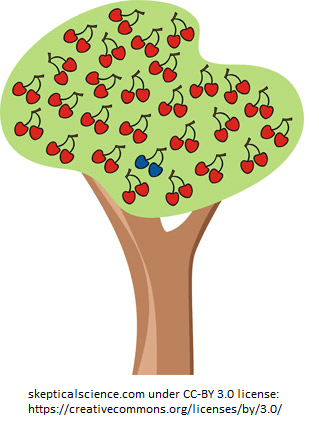
A small group of conspiracy theorists flip this reality by “cherry picking”, which means using a fraction of the data to prop up claims that are false globally. It’s the sort of technique that would insist that this is a 100% blue cherry tree.
NOAA scientists know that afternoons tend to be warmer than early mornings so it would be dumb to mix, for example, 1940s morning temperature readings with 2010s afternoon readings without accounting for this. They refuse to do obviously, provably dumb things so they carefully correct the data for a fair comparison. In the U.S., thermometers used to be read largely in the afternoon but now tend to be read in the morning1. This means that adjustments in the U.S. are warming, making it a popular choice for hints at conspiracy.
There are ways to judge whether new claims are credible. Firstly, do they mention that global adjustments are cooling overall? Secondly, do they discuss reasons for adjustments including measurement time? If the answer is “no” to either then the author is hiding relevant information or is clueless about the topic and you should be very sceptical.
Fortunately the scientific method can reliably test new claims through submissions to scientific journals for peer review, which tends to filter out obvious dumb mistakes like ignoring how afternoons are warmer than early mornings. Blog posts, think tanks and newspapers have no such filter.
We know that NOAA’s adjustments improve things since they’re tested and updated whenever issues are found. For example, even a blogger who’s hostile to climate science results published a paper confirming that the NOAA U.S. average temperature changes are solid2. Another study by an independent “red team”, partly funded by a Koch foundation, supported NOAA’s conclusions3.
I was involved with a check of NOAA’s ocean record using infrared scans from satellites4. The satellites supported NOAA’s results despite baseless & hysterical accusations that had been thrown at the scientists. After more than a decade of being relentlessly wrong, it’s time to be very careful with any new conspiracy claims aimed at the temperature records.
[This comment was initially provided as part of a claim review.]
- 1-Vose et al (2003) An evaluation of the time of observation bias adjustment in the U.S. Historical Climatology Network, Geophysical Research Letters
- 2-Fall et al (2011) Analysis of the impacts of station exposure on the U.S. Historical Climatology Network temperatures and temperature trends, Journal of Geophysical Research: Atmospheres
- 3-Rohde et al (2012) A New Estimate of the Average Earth Surface Land Temperature Spanning 1753 to 2011, Geoinformatics & Geostatistics: An Overview
- 4-Hausfather et al (2017) Assessing recent warming using instrumentally homogeneous sea surface temperature records, Science Advances
