Misrepresents the scientific process : Through research, scientists improve their understanding of the climate system, and this understanding is used to refine climate models as useful scientific tools. Science does not have a “mission” to reach a predetermined conclusion.

REVIEW
CLAIM: GCMs systematically over-estimate the sensitivity of climate to carbon dioxide (CO2), many known forcings and feedbacks are poorly modeled, and modelers exclude forcings and feedbacks that run counter to their mission to find a human influence on climate.
Reto Knutti, Professor, ETH Zürich:
The statement that climate models overestimate the warming in response to CO2 is incorrect; it is based on either too short time periods that are dominated by natural variability, by the comparison of models with datasets that do not have global coverage, by comparing to models that were run many years ago with emissions and forcings that differed from what actually happened, by the use of oversimplified energy balance models1, or a combination of it. Recent studies have shown that once the changes in climate feedbacks over time2, datasets with full coverage are considered3 and all forcings are considered, the agreement between predicted and observed warming is excellent, even over the recent hiatus period4.
It is remarkable that even projections made decades ago with climate models that were much simpler (and were running on computers that were likely slower than a mobile phone today) were quite accurate5,6,7.
- 1- Knutti and Rugenstein (2015) Feedbacks, climate sensitivity and the limits of linear models, Philosophical Transactions of the Royal Society A
- 2- Armour (2017) Energy budget constraints on climate sensitivity in light of inconstant climate feedbacks, Nature Climate Change
- 3- Richardson et al (2016) Reconciled climate response estimates from climate models and the energy budget of Earth, Nature Climate Change
- 4- Medhaug et al (2017) Reconciling controversies about the ‘global warming hiatus’, Nature
- 5- Stouffer and Manabe (2017) Assessing temperature pattern projections made in 1989, Nature Climate Change
- 6- Fischer and Knutti (2016) Observed heavy precipitation increase confirms theory and early models, Nature Climate Change
- 7- Allen et al (2013) Test of a decadal climate forecast, Nature Geoscience
Katrin Meissner, Professor, University of New South Wales:
False. Climate Sensitivity has been assessed by the community based on recent observations and proxy data from past climates. Climate models fall within this range of sensitivity. Some recent publications point to an increase in sensitivity with warmer temperatures*.
- Paleosens Project Members (2013) Making sense of palaeoclimate sensitivity, Nature
- Meraner et al (2013) Robust increase in equilibrium climate sensitivity under global warming, Geophysical Research Letters
- Zeebe (2013) Time-dependent climate sensitivity and the legacy of anthropogenic greenhouse gas emissions, Proceedings of the National Academy of Sciences
Patrick Brown, Assistant Professor, San Jose State University:
This argument reached a peak in popularity around 2012/2013 when the “hiatus” was still ongoing (i.e. when the divergence between observed and modeled global temperature was at its largest). Even then, however, it was shown that you cannot conclude much about sensitivity to CO2 from such short-term fluctuations1. Similarly, Brown et al. (2015)2 showed that decade-long periods without warming are to be expected and that there was/is a 70% chance of seeing at least one 11-year period with no warming between the years of 1993-2050 under a “middle of the road” emissions scenario.
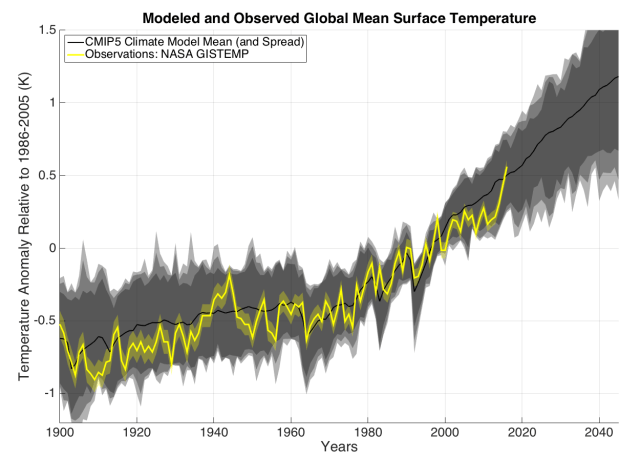
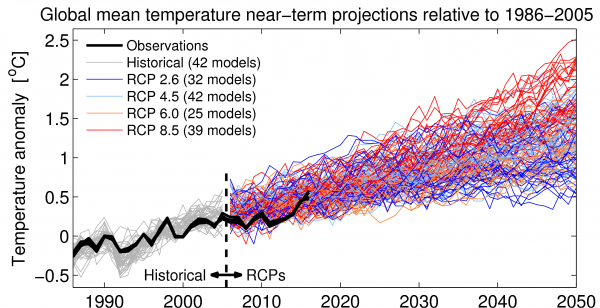
Since then, observed warming has surged and, as of 2016, observations are warmer than the average prediction from climate models (see figures below).
- 1- Marotzke and Forster (2015) Forcing, feedback and internal variability in global temperature trends, Nature
- 2- Brown et al (2015) Comparing the model-simulated global warming signal to observations using empirical estimates of unforced noise, Scientific Reports

Figure – Modeled global surface temperature (RCP 4.5 emissions scenario) compared to observed temperature (NASA GISS). Source

Figure – Updated version of IPCC AR5 Figure 11.25a, showing observations and the CMIP5 model projections relative to 1986-2005. The black lines represent observational datasets (HadCRUT4.5, Cowtan & Way, NASA GISTEMP, NOAA GlobalTemp, BEST). Source


