


REVIEW
CLAIM: Right on the NASA website, you can look and see in the year 2000 they showed about 0.5C total warming. In the year 2012, they pushed it up to about 0.9C warming. Now they show about almost 1.5C warming over lands[...] [T]he raw data, the actual thermometer data, which comes from this incredible network of very good, contiguous 1,200 stations in the US, shows that the US has been cooling for 80 to 90 years. But the graphs they release to the public show warming trend, and it's all because they've altered the data.
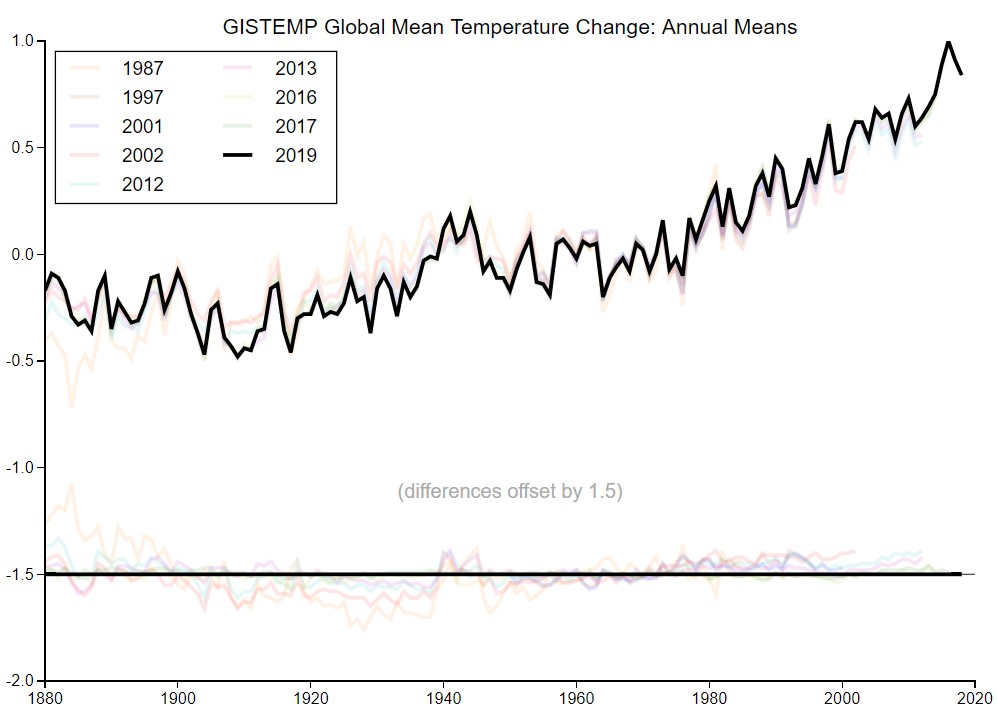
Differences between versions of NASA’s global temperature dataset can easily be viewed on the NASA website.
The most significant adjustments to data relate to changing ship-based instruments and methods used to measure sea surface temperatures around the time of World War II. As the use of thermometers in buckets of water hauled up on deck was replaced by thermometers in ship engine water intake pipes, the measured temperatures changed slightly, necessitating a correction to ensure an “apples-to-apples” comparison.
Datasets operated by NOAA in the US, the UK Met Office, and others match and support NASA’s results.
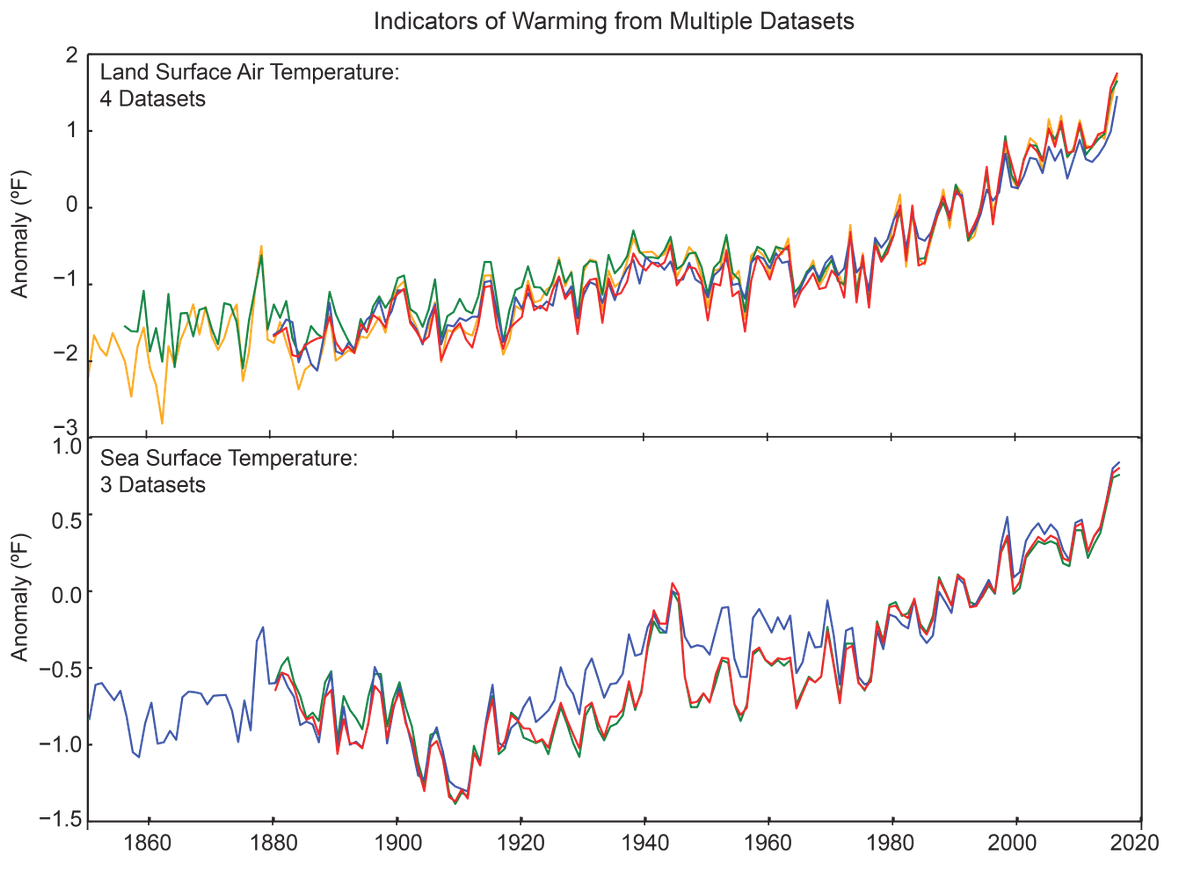
Bottom panel: NOAA (red), NASA (green), and UK Met Office (blue) datasets.
Source: US NCA
Mark Richardson, Research Associate, Colorado State University/NASA JPL:
[This comment was initially provided as part of a claim review.]
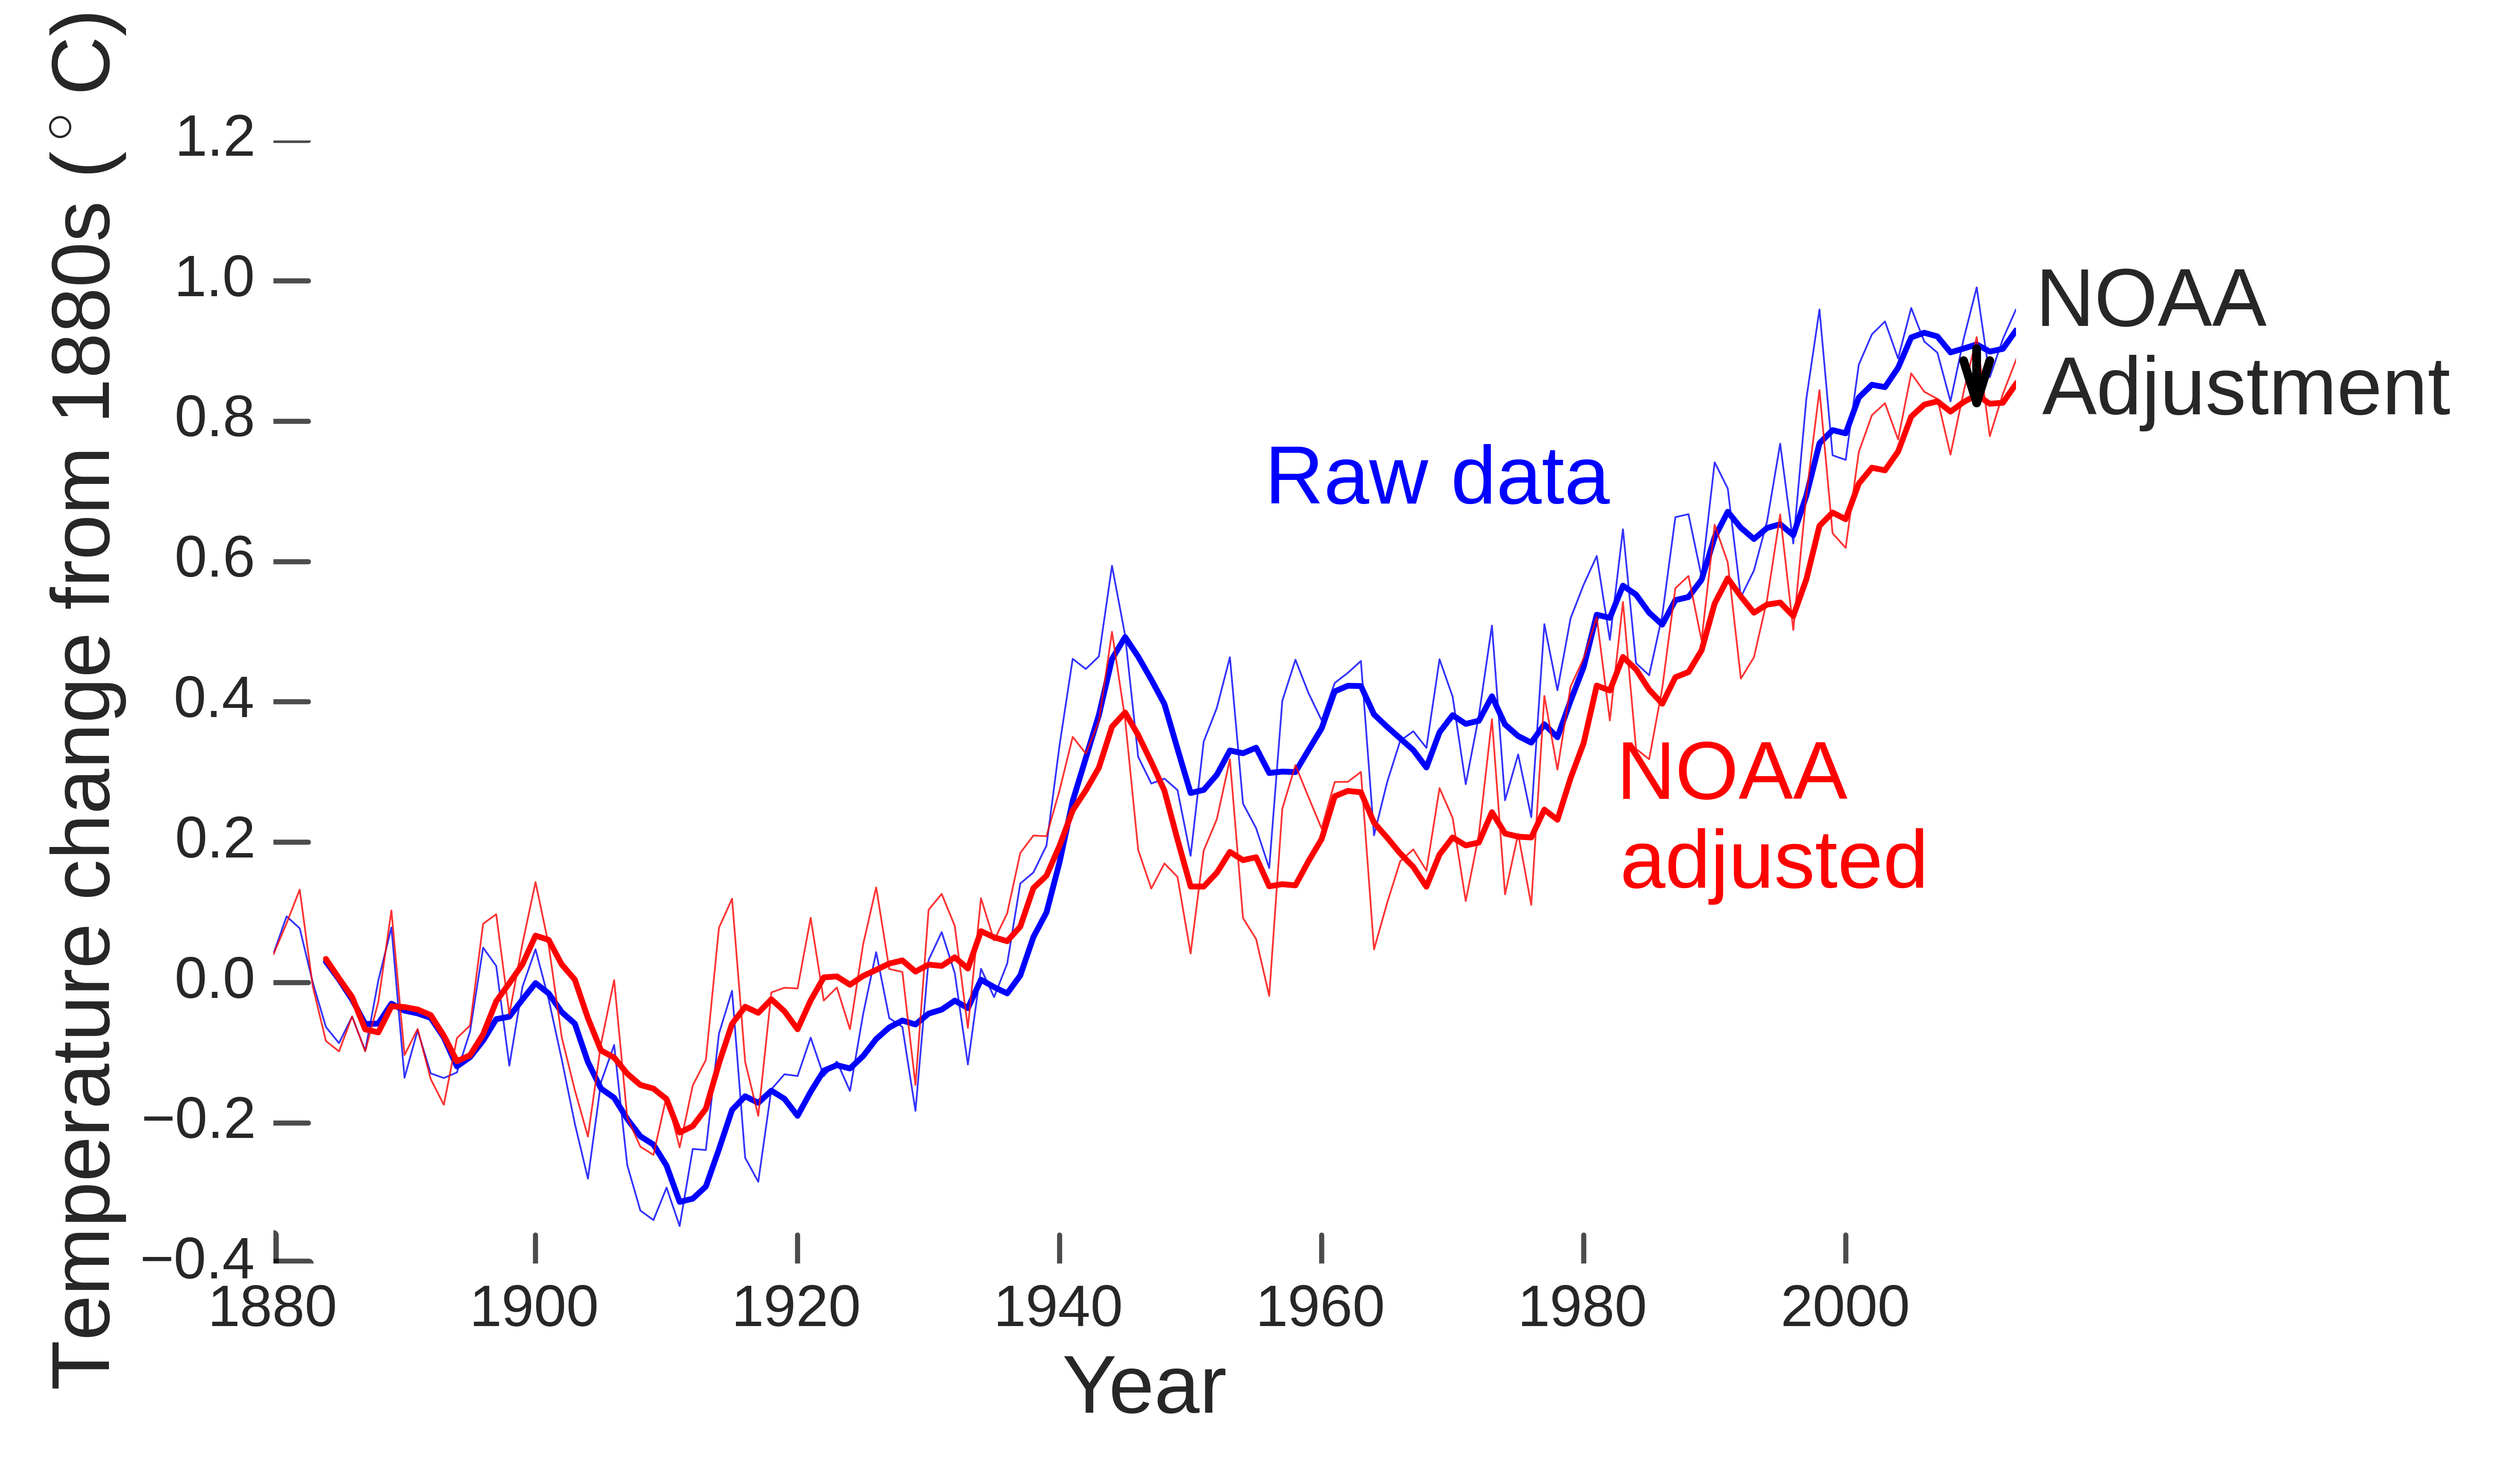
Raw data show more global warming since 1880 than is reported by NOAA [or shown in other datasets]. This is because NOAA “adjusts” temperature data to fairly compare different measurement times, places, and technologies. The cooling effect of adjustments on global temperatures has been shown lots of times, such as with the graph below for 1880—2013 temperatures.
A small group of conspiracy theorists flip this reality by “cherry picking”, which means using a fraction of the data to prop up claims that are false globally. It’s the sort of technique that would insist that this is a 100% blue cherry tree.
NOAA scientists know that afternoons tend to be warmer than early mornings so it would be dumb to mix, for example, 1940s morning temperature readings with 2010s afternoon readings without accounting for this. They refuse to do obviously, provably dumb things so they carefully correct the data for a fair comparison. In the U.S., thermometers used to be read largely in the afternoon but now tend to be read in the morning1. This means that adjustments in the U.S. are warming, making it a popular choice for hints at conspiracy.
There are ways to judge whether new claims are credible. Firstly, do they mention that global adjustments are cooling overall? Secondly, do they discuss reasons for adjustments including measurement time? If the answer is “no” to either then the author is hiding relevant information or is clueless about the topic and you should be very sceptical.
Fortunately the scientific method can reliably test new claims through submissions to scientific journals for peer review, which tends to filter out obvious dumb mistakes like ignoring how afternoons are warmer than early mornings. Blog posts, think tanks and newspapers have no such filter.
We know that NOAA’s adjustments improve things since they’re tested and updated whenever issues are found. For example, even a blogger who’s hostile to climate science results published a paper confirming that the NOAA U.S. average temperature changes are solid2. Another study by an independent “red team”, partly funded by a Koch foundation, supported NOAA’s conclusions3.
I was involved with a check of NOAA’s ocean record using infrared scans from satellites4. The satellites supported NOAA’s results despite baseless & hysterical accusations that had been thrown at the scientists. After more than a decade of being relentlessly wrong, it’s time to be very careful with any new conspiracy claims aimed at the temperature records.
- 1-Vose et al (2003) An evaluation of the time of observation bias adjustment in the U.S. Historical Climatology Network, Geophysical Research Letters
- 2-Fall et al (2011) Analysis of the impacts of station exposure on the U.S. Historical Climatology Network temperatures and temperature trends, Journal of Geophysical Research: Atmospheres
- 3-Rohde et al (2012) A New Estimate of the Average Earth Surface Land Temperature Spanning 1753 to 2011, Geoinformatics & Geostatistics: An Overview
- 4-Hausfather et al (2017) Assessing recent warming using instrumentally homogeneous sea surface temperature records, Science Advances
Victor Venema, Scientist, University of Bonn, Germany:
[These comments were initially provided as part of an article review.]
To estimate how much the world has warmed, other changes need to be removed from the observations made at weather stations, observing ships and buoys. For example, if the surrounding of a station becomes more urban this often causes a warming that is local and needs to be removed to estimate the amount the world has truly warmed. Similarly when such a station moves to a better location, which is cooler, such a cooling jump needs to be removed for an accurate warming estimate.
When it comes to the global mean temperature the main effect that needs to be removed is that in the past many sea surface temperature observations were made by hand with buckets and nowadays are made automatically at the water inlet of ships. While the water is hauled on deck and the thermometer adapts to the water temperature, the sea water evaporates and cools. Old measurements are thus 0°C to 0.4°C (0.7°F) too cold.
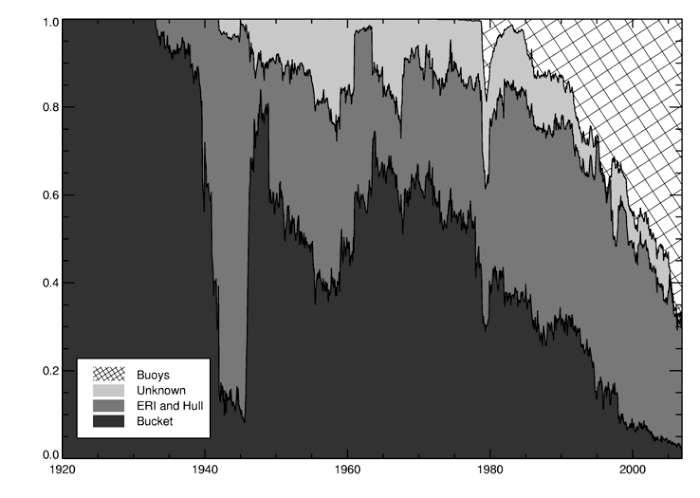
Source: UK MetOffice
In the unscientific formulation of [some], this means that the adjustments for this effect make the past warmer and the recent temperatures colder. But overall, the estimated global warming actually becomes smaller when taking into account all the adjustments—the opposite of [that claim]. [See figure in Mark Richardson’s comment above.]
The adjustments climatologists make for land station data do make the warming greater. But the ocean adjustments (which reduce the warming trend) are more important for the global average.
How large the adjustments need to be depends on how many other changes there were. The adjustments in the United States of America are relatively large, mainly due to two effects.
In the past the thermometers were read more often in the afternoon, while nowadays they are read more often in the morning. The estimates of the daily average temperature based on minimum and maximum temperature thermometers are a bit colder in the morning than in the afternoon. A particularly cold morning can affect the observed minimum temperature of two days and a very hot afternoon the maximum temperature of two days.
The temperature used to be measured with a thermometer in a Cotton Region Shelters in the USA. Nowadays they are mostly made using an Automatic Weather Station. These Automatic Weather Stations on average measure a lower temperature because they heat up less standing in the sun. The difference is especially large for the maximum temperature and for the summer. Comparing old summer maximum temperature with those of today would not be comparing like with like.
And even if we had not invented the thermometer we would know it is warming:
Glaciers are melting, from the tropical Kilimanjaro glaciers, to the ones in the Alps and Greenland. Arctic sea ice is shrinking. The growing season in the mid-latitudes has become weeks longer. Trees bud and blossom earlier. Wine grapes can be harvested earlier. Animals migrate earlier. The habitat of plants, animals and insects is shifting poleward and up the mountains. Lakes and rivers freeze later and break up the ice earlier. The oceans are rising.
