Incorrect : Anthropogenic emissions of CO2 and other greenhouse gases are the leading cause of global mean temperature rise in the industrial era. Solar activity plays only a minor role in current climate changes, and is not a major contributor to the global warming trend observed over the past decades.

REVIEW
CLAIM: They changed it from global warming to climate change. Do you know why ? Because, when scientists are looking into global warming, there was no factual data to back up their argument. Real scientists are still debating whether CO2 or solar sunspots or natural variability cause global warming
REVIEW
The claim appeared in a video posted on Facebook and Instagram by Turning Point USA, a partisan organization that advocates for conservative policies on high school, college, and university campuses The video, featuring Charlie Kirk, founder of Turning Point USA, and Candace Owens, received more than 640,000 views on Facebook alone since it was published on 11 April 2021.
First, there is no evidence to support the claim that “they changed from global warming to climate change”. Climate scientists use both terms in the scientific literature, as they refer to two distinct, but causally-related phenomena. Global warming describes the long-term trend of increasing average global temperature, whereas climate change refers to changes in the various measures of climate. These measures include temperature, as well as precipitation, wind patterns, drought prevalence, and the occurrence of other extreme events.
In 2005, the National Academy of Sciences stated that “the phrase ‘climate change’ is growing in preferred use to ‘global warming’ because it helps convey that there are changes in addition to rising temperatures”[1]. There’s no evidence that a complete shift in terminology took place, and there’s no reason to do so, contrary to the video’s claim.
Second, many lines of scientific evidence unambiguously demonstrate that the Earth’s surface is experiencing rapid global warming. The first line of evidence is the continuous record of surface temperatures recorded at thousands of weather stations worldwide. Some records date back to the early eighteenth century. When averaged together, these data indicate a clear increasing trend in the Earth’s surface temperature.
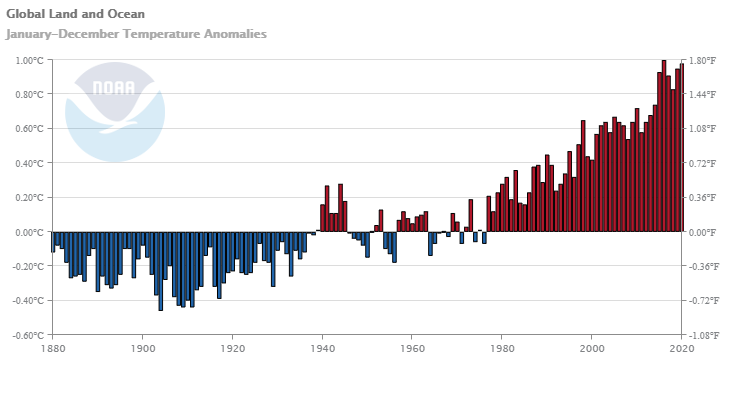
According to the 2018 IPCC report, “Human activities are estimated to have caused approximately 1.0°C of global warming above pre-industrial levels, with a likely range of 0.8°C to 1.2°C”[2]. And the rate of global warming is accelerating, as stated in NOAA’s latest report, “the global annual temperature has increased at an average rate of 0.08°C (0.14°F) per decade since 1880 and over twice that rate (+0.18°C / +0.32°F) since 1981”. Furthermore, some of the warmest years in the 141-year record occurred in the last decade, with 2016 being the warmest and 2020 being the second warmest (see figure below).
Figure—Global temperature anomaly data relative to the 20th century average temperature from the Global Historical Climatology Network-Monthly data set and International Comprehensive Ocean-Atmosphere Data Set. These data sets show consistent global warming trends. From NOAA.
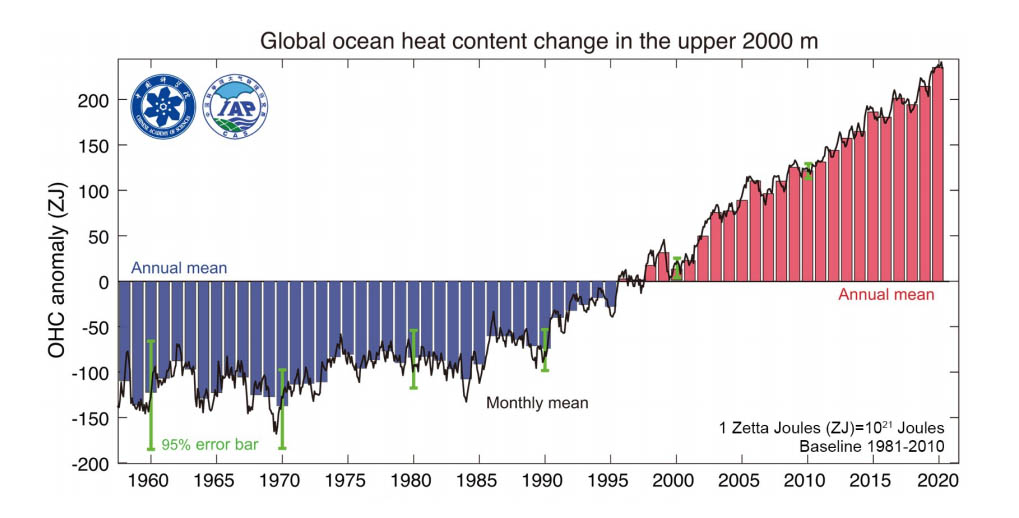
Another line of evidence of global warming is the increase in ocean heat content observed by scientists over the past decades. The increased concentration of heat-trapping greenhouse gases in the atmosphere generated an energy imbalance in the Earth’s climate system of almost 1 W m−2 [3]. This means that Earth radiates less energy to space than it receives from the Sun, essentially less heat is going out, than is going in. Over 90% of this excess heat accumulates in the ocean because of its large heat capacity compared to the atmosphere. Over the past decades, scientists have observed an increase in ocean heat content. Specifically, each decade has been warmer than the preceding decade in terms of ocean heat content, and 2020 hit a record high (see figure below).
Figure—Global upper 2000 m ocean heat content (OHC) from 1958 through 2020. The histogram presents annual anomalies relative to a 1981-2010 baseline, with positive anomalies shown as red bars and negative anomalies as blue. Units : Zetta Joules (ZJ, equals to 1021 Joules). From Advances in Atmospheric Science.
According to Cheng et al. (2021), “the most recent data indicate that the ocean heat content in the upper 2000 m layer of the world’s oceans has increased with a mean rate of 5.7 ± 1.0 ZJ yr−1 for the 1958−2020 period”[4]. (The unit is in ZettaJoules, which is equivalent to 1021 Joules, that is millions of millions of billions). The authors also found that there is a more rapid increase that began in the 1980s. The average annual increase from 1986 to 2020, is almost eight times larger than the linear rate from 1958~1985.
Sea level rise, which scientists have observed since 1900, is another line of evidence that global warming is occuring[5]. Sea level rise is caused, in part, by the thermal expansion of the oceans and, in part, by the melting of glaciers on land. In addition to rising temperatures of Earth’s atmosphere and oceans, global warming has caused land and sea ice to melt. “Over the last decades, global warming has led to widespread shrinking of the cryosphere”, as stated in a special report on the ocean and cryosphere released by the IPCC[6].
“Most glaciers are shrinking (high confidence), the Greenland and Antarctic ice sheets are losing mass (high confidence), sea ice extent in the Arctic is decreasing (very high confidence), Northern Hemisphere snow cover is decreasing (very high confidence), and permafrost temperatures are increasing (high confidence).”
Multiple studies demonstrated that ecosystems are also responding to global warming in numerous ways[7]. For example, many ecosystems experience earlier springs and later falls compared to the 20th-century averages. Global warming is also driving large-scale shifts in species distributions, as many animals and plants are moving higher in elevation and latitude to find suitable habitats[8].
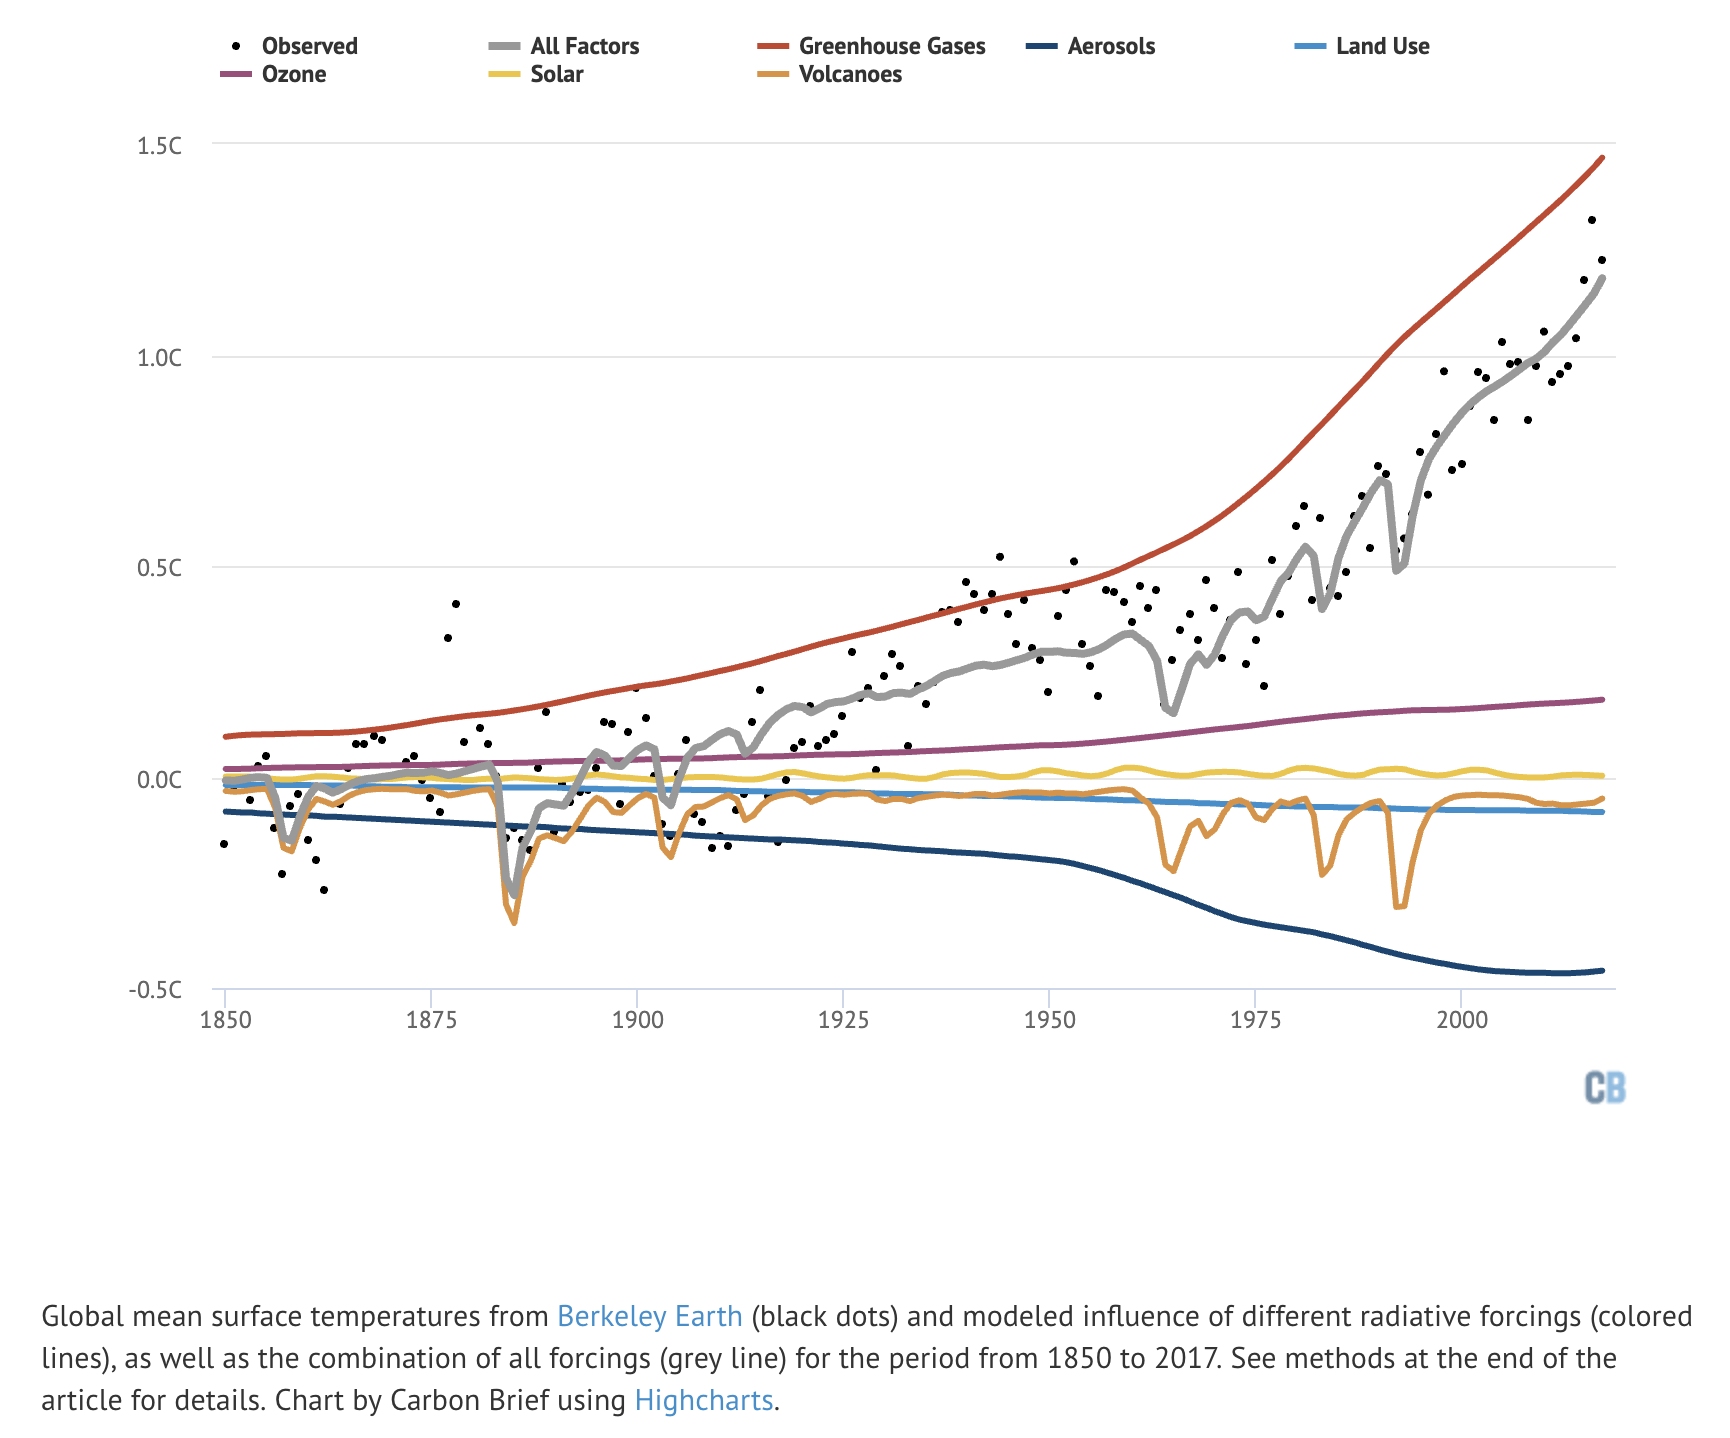
Finally, the claim that real scientists don’t know whether CO2 or solar sunspots or natural variability causes global warming is incorrect. According to the IPCC, the current scientific consensus is that variations in solar activity only play a very small role in Earth’s recent climate[9]. Human-produced greenhouse gases are the primary cause of global warming trends and their effects are much stronger than those due to recent variations in solar activity. The human-caused drivers of global warming and climate change are well understood and reflect decades of research on the topic[10]. For example, an analysis of the major factors that influence global surface temperatures, and how their effects change over time, found that human-caused increases in greenhouse gas emissions account for 100% of the warming trends observed over the past century, given that humans also cause cooling effects such as the emissions of particles (aerosols) (see figure below).

Figure—The estimated role of different factors influencing global surface temperatures from 1850 to 2017. Observed temperatures are shown in black dots. Global warming over the past 150 years was primarily driven by greenhouse gas emissions (red). Solar activity (yellow) is a minor contributor and follows the Sun’s natural 11-year cycle. From Carbon Brief.
The role of human activity in the increase in global CO2 concentration is also unquestionable. Scientists are now able to track fossil fuel emissions by measuring the level of radioisotope carbon-14 (14C) in the air[11]. This natural isotope has a half-life of 5,700 years and is widely used in archeological studies for dating. Fossil fuels are completely devoid of 14C, because they have been buried for millions of years, and have lost all of it through radioactive decay. Therefore, the degree of 14C-depletion of the CO2 in air samples reflects the contribution from fossil fuel combustion.
Kirk dismisses the significance of the scientific consensus on the subject of human-caused global warming, but scientific consensus is important insofar as it reflects the consensus of evidence that supports or refutes competing hypotheses, and scientists with expertise on the subject are able to assess the evidence. In the case of climate change, the evidence accumulated over the past few decades is consistent with the explanation that human activities are the cause of the observed increases in global temperature.
Kirk says that “we don’t vote on gravity, we don’t vote on Newton’s second law, we prove it”. But this is also a misunderstanding of how science works. Scientists do not “prove” that a hypothesis is valid in the mathematical sense of the term, instead they propose all the hypotheses that could explain a given phenomenon (here the increase in global temperature) and then they collect data to evaluate whether the data is consistent or inconsistent with each hypothesis. For instance, the hypothesis that solar activity explains current global warming trends was ruled out since, among other pieces of evidence, the entire atmosphere hasn’t warmed[12], which would be the case if that hypothesis was true. The hypothesis that natural variation within the climate system explains global warming was also ruled out, as no natural mechanism has been found that could explain the trends observed over the past century. In addition, a natural cycle coming from the ocean for instance would redistribute heat in the ocean and not simply increase the amount of heat in the oceans as observed.
Contrary to Kirk’s assertion, it is the failure to disprove the theory of gravity that led scientists to accept its validity. The same is true for global warming: hypotheses stating that “there is no warming” or that “warming is caused by something else other than human activity” fail to propose a verifiably valid explanation for the warming trends observed, making the human-influence explanation the only valid one.
SCIENTISTS’ FEEDBACK
Baird Langenbrunner, Associate Editor, Nature Climate Change:
SCIENTISTS’ FEEDBACK
There has been very clear and measurable warming since this time period [industrial revolution]—this has been confirmed time and time again using station data and satellite measurements and it matches well with predictions based on increases in greenhouse gas concentrations. Even in the brief periods when the surface temperature warms less quickly, the oceans continue to warm, which together with the atmosphere accounts for all the extra heat predicted by increased greenhouse gas concentrations.
Stephen Po-Chedley, Research Scientist, Lawrence Livermore National Laboratory:
This claim is not accurate. Global temperature datasets, developed by a number of independent research groups, show robust warming in the troposphere and at the Earth’s surface. The radiative effect of carbon dioxide has also been observed[13]. Considering multiple lines of evidence, the IPCC concluded that it is “extremely likely that human influence has been the dominant cause of the observed warming since the mid-20th century.” More recent analysis of satellite data shows that tropospheric warming from the satellite record is pronounced and cannot be explained by natural climate variability alone[14].
Gavin Schmidt, Director, NASA Goddard Institute for Space Studies:
There is indeed overwhelming evidence for warming in the last century. [The] claim that no one knows the attribution of this to human impacts is not a valid description of the state of knowledge. There are indeed plenty of studies that use statistical or model-based fingerprints to assess this and they overwhelmingly find a dominance of human activities over natural forcings or internal variability. For the more recent period (1950 onwards) the claims are even stronger—that effectively all the warming is caused by human activity with only a ~10% uncertainty due to internal variability.
UPDATE
20 May 2021: Charlie Kirk has issued a correction saying that their claims were false (see the screenshot below). The video has now been deleted.
REFERENCES
- 1 – The National Academy of Sciences (2005) Understanding and responding to climate change.
- 2 – IPCC (2018) Summary for Policymakers. IPCC Special Report on the impacts of global warming of 1.5°C above pre-industrial levels and related global greenhouse gas emission pathways.
- 3 – Trenberth et al. (2014) Earth’s energy imbalance. Journal of Climate.
- 4 – Cheng et al. (2021) Upper Ocean Temperatures Hit Record High in 2020. Advances in Atmospheric Science.
- 5 – Frederikse et al. (2020) The causes of sea-level rise since 1900. Nature.
- 6 – IPCC (2019) Framing and context of the report. IPCC Special Report on the Ocean and Cryosphere in a Changing Climate.
- 7 – Weiskopf et al. (2020) Climate change effects on biodiversity, ecosystems, ecosystem services, and natural resource management in the United States. Science of the Total Environment.
- 8 – Burrows et al. (2011) The Pace of Shifting Climate in Marine and Terrestrial Ecosystems. Science.
- 9 – IPCC (2013) Anthropogenic and natural radiative forcing. Climate Change 2013: The Physical Science Basis. Contribution of Working Group I to the Fifth Assessment Report of the Intergovernmental Panel on Climate Change.
- 10 – Hegerl and Zwiers (2011) Use of models in detection and attribution of climate change, Wires Climate Change.
- 11 – Basu et al. (2020) Estimating US fossil fuel CO2 emissions from measurements of 14C in atmospheric CO2, PNAS.
- 12 – Ogawa et al. (2014) Upper atmosphere cooling over the past 33 years, Geophysical Research Letters.
- 13 – Feldman et al (2015) Observational determination of surface radiative forcing by CO2 from 2000 to 2010, Nature.
- 14 – Santer et al. (2017) Tropospheric Warming Over The Past Two Decades, Scientific Reports.


