


REVIEW
CLAIM: NOAA graph doesn’t show a full record of radiosonde temperature data; "the warming that has taken place in the last 37 years was preceded by a 21 year "cooling" period. The 58 year net gain of global temperature is zero. We are simply in a cyclical, normal ebb and flow of temperature."
REVIEW
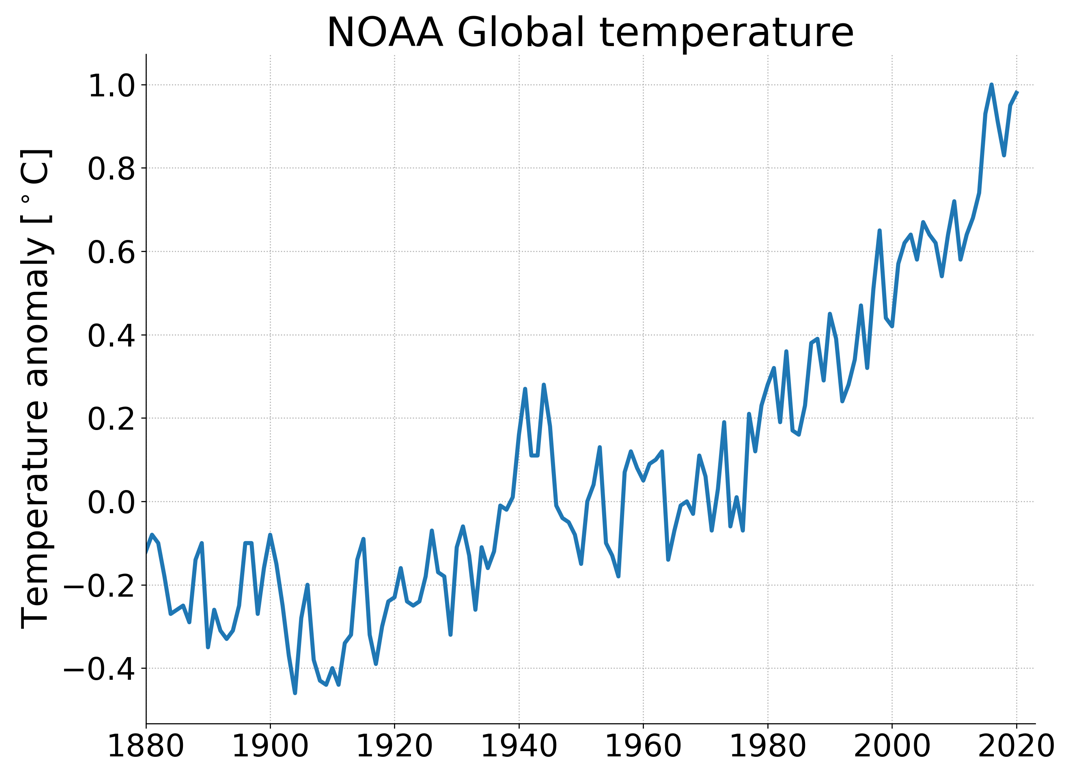
The claim that there has been no increase in global temperature over the past 58 years was published by numerous users on Facebook in late January and early February 2021 (see example here), receiving thousands of interactions on the platform. This claim is incorrect, as data from NOAA has clearly demonstrated strong global warming trends over the past 58 years, as well as over longer timescales (see figure below)[1-3].
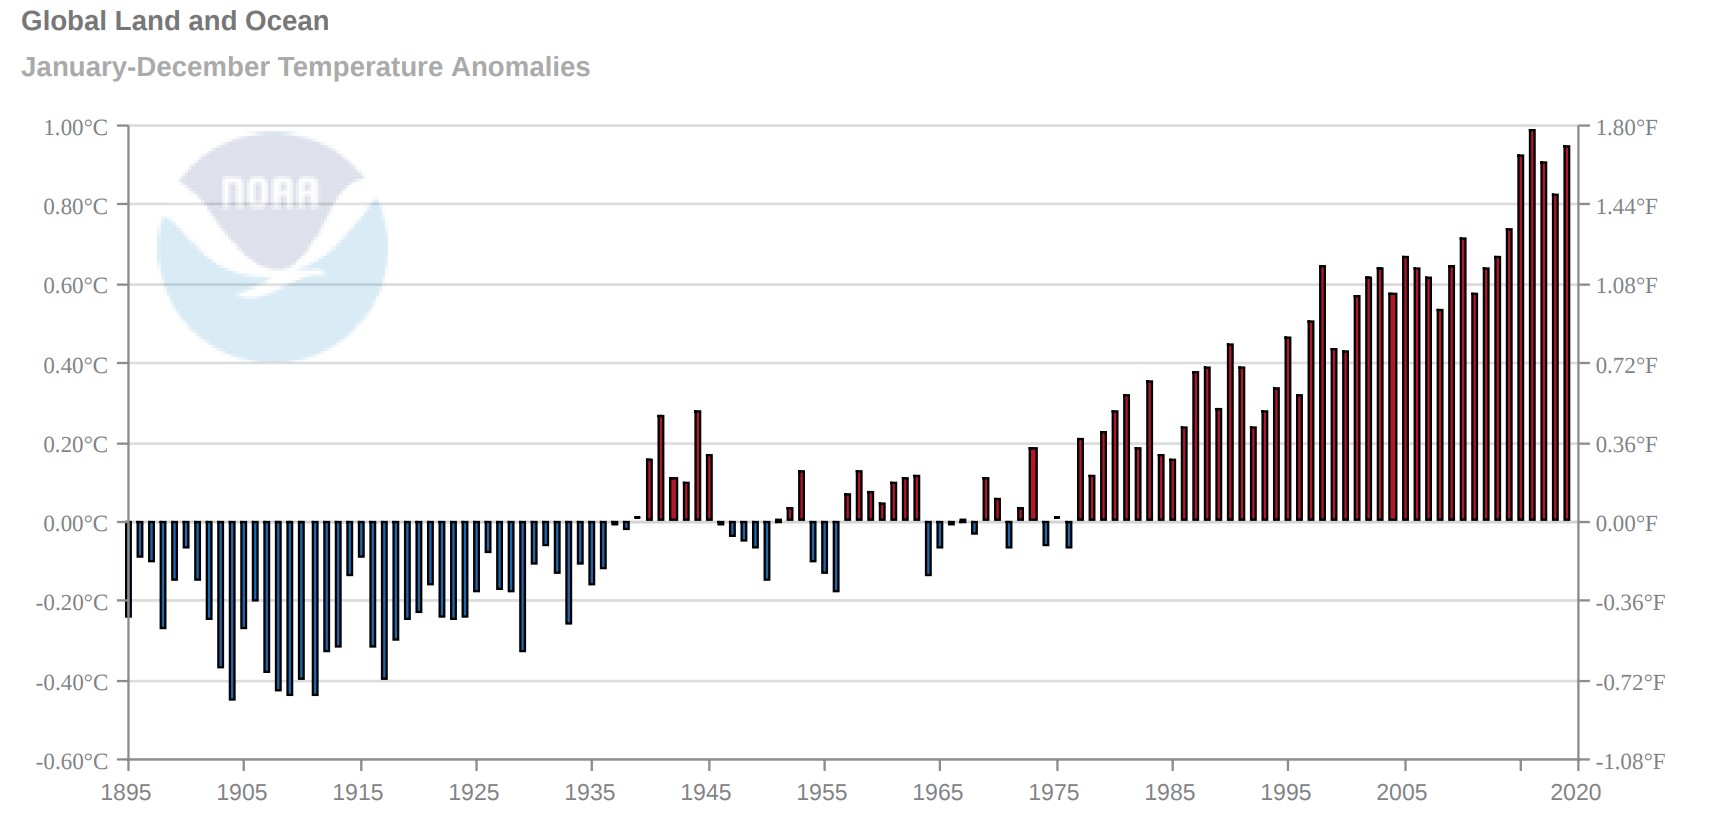
Figure 1—Global temperature anomaly data of Earth’s ocean and land surface relative to the 20th century average temperature from the Global Historical Climatology Network-Monthly data set and International Comprehensive Ocean-Atmosphere Data Set. These data sets show consistent global warming trends. From NOAA.
The posts also make the incorrect claim that “we are simply in a cyclical, normal ebb and flow of temperature”. As stated in the IPCC 2014 report, “Warming of the climate system is unequivocal, and since the 1950s, many of the observed changes are unprecedented over decades to millennia.”[1]
The Fourth National Climate Assessment also states, “Global annually averaged surface air temperature has increased by about 1.8°F (1.0°C) over the last 115 years (1901–2016). This period is now the warmest in the history of modern civilization. The last few years have also seen record-breaking, climate-related weather extremes, and the last three years have been the warmest years on record for the globe.”[2]
The posts imply that NOAA is hiding radiosonde data because they released a graph from the past 37 years even though they had 58 years of data. However, the posts don’t show the graph or provide any references to support this claim. Although it is unclear from the posts, this claim may have originated from a 2016 blog post that claimed, “NOAA Radiosonde Data Shows No Warming For 58 Years”. This claim is false, as radiosonde data from 1958 to 2019 show a clear trend of global warming[4].
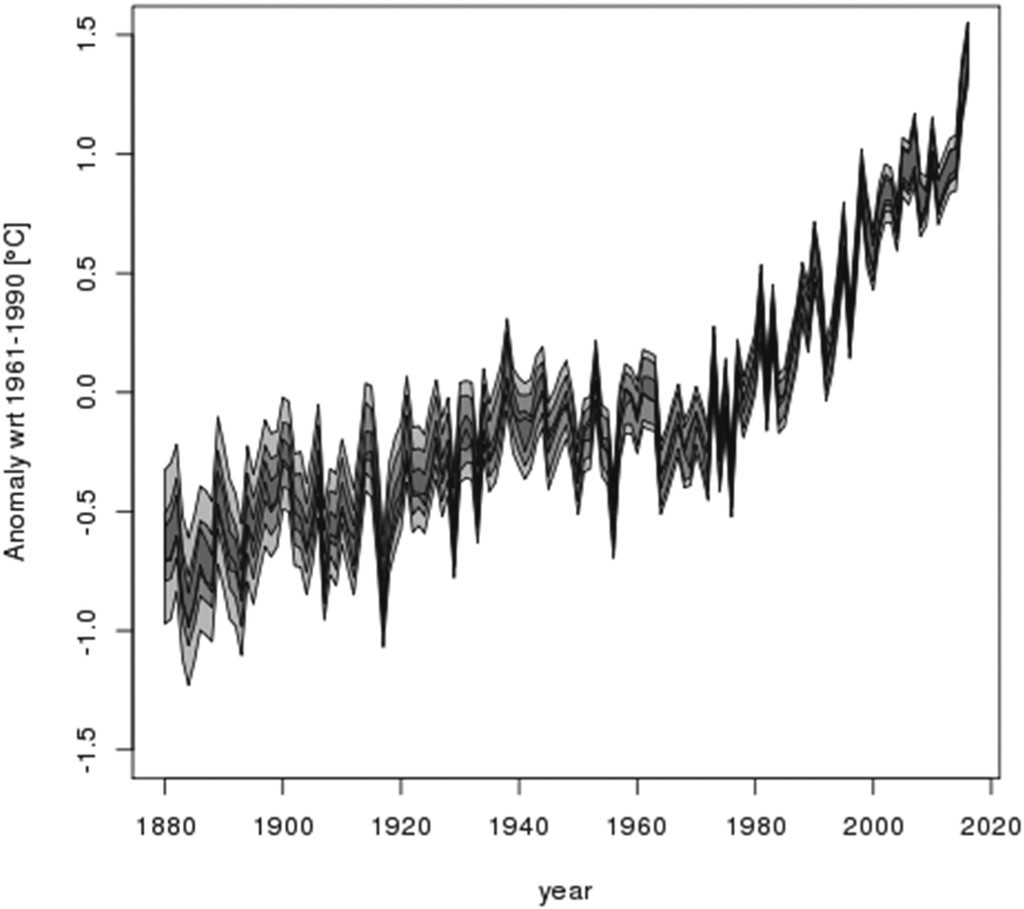
A radiosonde is a small instrument suspended from a large balloon that transmits data on pressure, temperature, and relative humidity. NOAA uses radiosondes to assess long-term temperature trends in some regions of the Earth’s atmosphere, including the troposphere and lower-stratosphere. Radiosonde data from 1958 to 2019 shows that the global warming rate of the troposphere is 0.18°C per decade[4]. These warming trends are also evident from satellite data (see figure below)[4,5].
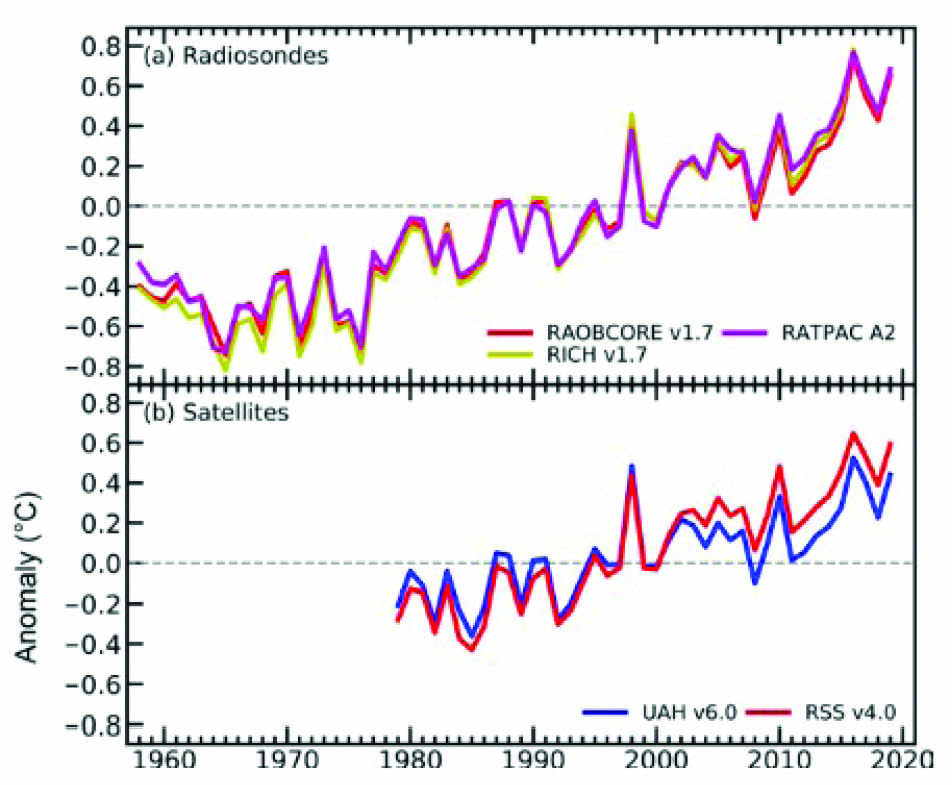
Figure 2—Global annual temperature anomalies for the lower troposphere from radiosondes (top) and satellites (bottom) from 1958 to 2019. Adapted from Ades et al. (2020)[4].
Human-caused greenhouse gas emissions are expected to warm the lower troposphere while cooling the upper layers of the atmosphere[6]. This is because the lower troposphere acts as an insulating blanket that traps and re-emits infra-red radiations near the Earth’s surface. As more greenhouse gases are emitted into the atmosphere, more heat is trapped in the lower troposphere, resulting in a cooling effect in the upper layers of the atmosphere.
SCIENTISTS’ FEEDBACK
Stephen Po-Chedley, Research Scientist, Lawrence Livermore National Laboratory:
This claim is false. Full time series of radiosonde (balloon-borne) temperature measurements (since 1958) are not new and are frequently depicted in routine climate reports. For example, in the State of the Climate in 2019 Report (on NOAA’s website), Figure 2.7 (in Global Climate, Figure reproduced above as Figure 2) shows the data since 1958 in a NOAA dataset (RATPAC vA2). The rate of warming over both the full period (1958 – 2019) and the satellite era (1979 – 2019) are noted in Table 2.3 (see table below).
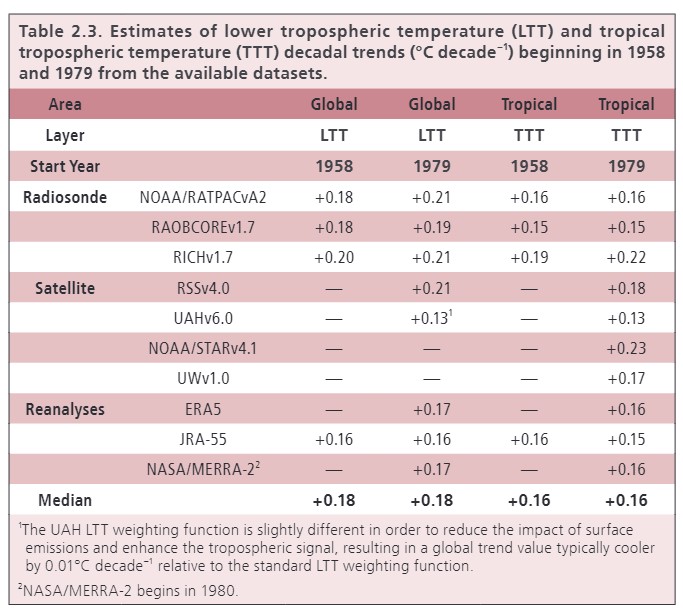
Both time periods show rapid warming of the Earth’s lower atmosphere (the troposphere). Similar data was shown in the report a decade ago (here)[7]. It is true that global atmospheric and surface warming is not perfectly linear and global temperature was relatively flat over 1958 – 1980. This feature is reproduced by climate models and is driven by human and volcanic emissions of aerosols (which tend to cool the planet). This is demonstrated, for example, in the Fourth National Climate Assessment (see interactive Figure 2.1). Global warming is not a myth and is evident in a wide variety of geophysical measurements of the Earth’s atmosphere, oceans, and cryosphere.
Mark Richardson, Research Associate, Colorado State University/NASA JPL:“Radiosonde temperature data” are taken by weather balloons and NOAA’s “RATPAC” temperature record, which began in 1958, was published in 2005[8] and is currently on the NOAA website. Since “global warming” usually means near the surface where we live, here are NOAA weather balloon temperatures from the surface up to about 5.5 km (18,000’). Temperatures at the NOAA weather balloon stations have increased by about 1 °C (1.8 °F) since 1958 (see figure below).
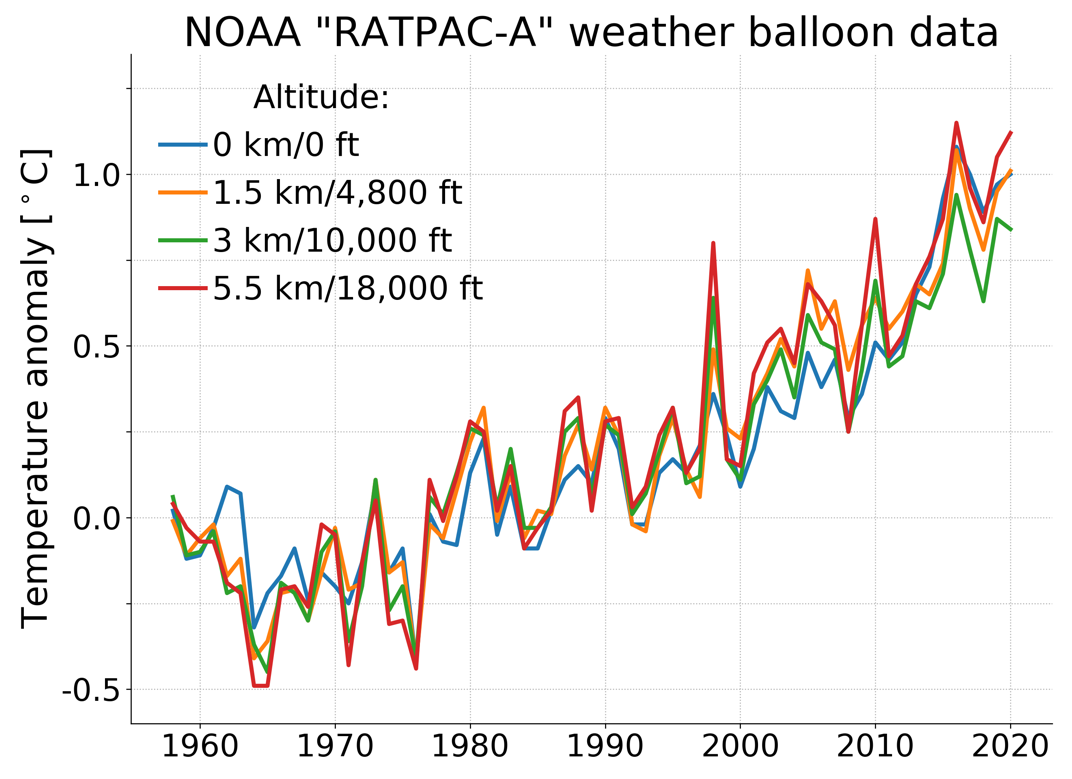
This Facebook post is misleading to say that NOAA “just released that they have 58 years” of this data, because it has been public for at least 15 years. That data shows about 1 °C (1.8 °F) warming since 1958, so the Facebook post is wrong to say “the 58 year gain of global temperature is zero”. It misleads readers by making up things that aren’t true.
Unfortunately, there aren’t many weather-balloon stations and they usually launch from land, missing the ~70 % of Earth’s surface is ocean. Weather balloons are useful, but don’t give the most complete picture of global warming. That comes from weather stations, ships and buoys combined. Here is the 1880—2020 NOAA temperature record that shows the clear warming pattern since 1958 and before.
The claim seems to be about NOAA’s radiosonde temperature dataset RATPAC, which includes data from 1958 to the present. That dataset currently spans 62 years, suggesting that the meme is 4-5 years old. NOAA’s RATPAC homepage gives four publications from 2003 and 2005 that showed data starting in 1958.
In this case, the 37-year period would end in 2016, and the 37 years could correspond to a graph comparing radiosondes to the satellite retrievals, which start in 1979. Another reason the author of the claim may have seen data plotted starting in 1979 is that the more recent data is more reliable.
The claim does not accurately describe the warming of the Earth. The land warming estimate of NOAA’s Global Historical Climate Network version 4 can be found below[9]. Clearly there was warming over the full period and the variations are not cyclical. The period 1958 to 1979, where the author of the claims that there is as much cooling as there is warming in the latter period is not warming. The reason for this is well understood: a fast increase in air pollution from a rapid expansion of fossil fuel use[10].
The above graph shows the temperature over land at the surface. The claim does not specify which temperature dataset they are referring to. It could describe the upper air temperature at the 850 mbar pressure level of RATCAP shown below[9]. Even at the 200 mbar level there is no warming and at the 50 mbar level the atmosphere is cooling. The warming at the surface and the cooling higher up are one of the predicted signatures of global warming due to an increase in greenhouse gases.
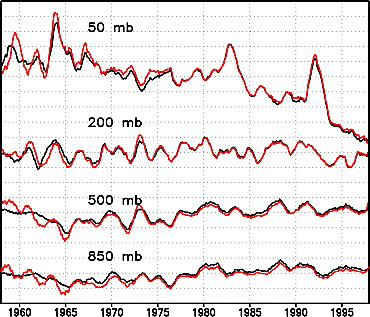
Global warming refers to the warming at surface level. The station dataset is a much better way to estimate this. Not only are station observations made with better instruments of a higher quality than the one-use radiosonde data, but we also have many more stations, which gives a better estimate of the average warming, especially in the Southern Hemisphere. The longer period for which we have station data helps see that cycles the claim talks about are not an accurate description of global warming.
REFERENCES:
- 1 – IPCC (2014) Climate Change 2014: Summary for Policymakers. Contribution of Working Groups I, II and III to the Fifth Assessment Report of the Intergovernmental Panel on Climate Change.
- 2 – Wuebbles et al. (2017) Executive summary. In: Climate Science Special Report: Fourth National Climate Assessment, Volume I.
- 3 – Neukom et al. (2019) No evidence for globally coherent warm and cold periods over the preindustrial Common Era. Nature.
- 4 – Ades et al. (2020) Global Climate. Bulletin of the American Meteorological Society.
- 5 – Santer et al. (2017) Tropospheric Warming Over The Past Two Decades. Scientific Reports.
- 6 – Santer et al. (2013) Human and natural influences on the changing thermal structure of the atmosphere. PNAS.
- 7 – Blunden et al. (2011) State of the Climate in 2010. Bulletin of the American Meteorological Society.
- 8 – Free et al. (2005) Radiosonde Atmospheric Temperature Products for Assessing Climate (RATPAC): A new data set of large‐area anomaly time series. Journal of Geophysical Research.
- 9 – Menne et al. (2018) The Global Historical Climatology Network Monthly Temperature Dataset, Version 4. Journal of Climate.
- 10 – Haustein et al. (2019) A Limited Role for Unforced Internal Variability in Twentieth-Century Warming. Journal of Climate.
UPDATES
- 8 February 2021: This post was updated to include comments from Mark Richardson and Victor Venema.