


REVIEW
CLAIM: ”If carbon dioxide was the main cause of warming, then there should be a rise in temperature along the carbon dioxide curve, but it doesn’t“; “They say the polar bear will go extinct in 2100... In fact, this past winter in the Arctic saw an expansion of ice from previous years, and Antarctica was colder during the last winter than in the past 50 years“; “We do not know the cause of these periodic fluctuations in temperature, but it was certainly not CO2; A study in 2013 found that increased levels of carbon dioxide (CO2) have helped boost green foliage across the world’s arid regions over the past 30 years.“
The Epoch Times laid out a range of inaccurate and misleading claims from Canadian industry consultant and former activist Patrick Moore in a September article, outlining statements from Moore taken from emails between himself and South Korean professor Seok-soon Park in late 2021.
Polar bears and melting sea ice
In the article, Moore claims that the polar bear population has “increased from 6,000 to 8,000 in 1973 to 30,000 to 50,000 today,” and that the polar bear is not threatened by melting sea ice in the Arctic.
In fact, as of 2015, which was the last time the animal was assessed, the IUCN estimates the total population of polar bears at 22,000 to 31,000 individuals.[1] Recent research has found that polar bears face an uncertain future as Arctic sea ice melts: Because the animals depend on sea ice for hunting, and because seals, their prey of choice, also depend on sea ice for breeding and making dens, sea ice loss is making it more difficult for polar bears to hunt. A 2020 study estimated that, “with high greenhouse gas emissions, steeply declining reproduction and survival will jeopardize the persistence of all but a few high-Arctic subpopulations [of polar bears] by 2100.”[2] (Climate Feedback evaluated New York Times coverage of this study in 2020 and found it to be correct. We also evaluated a claim similar to Moore’s in 2020, which asserted that polar bear populations were “growing” and “thriving,” and found it to be incorrect). Numerous other studies have warned of the threat posed to polar bear populations by melting sea ice. A 2021 study published in Earth’s Future predicts, for instance, that under high warming (over 2°C) scenarios, “seals will not be able to den (Hezel et al., 2012); [and] polar bears will not have sufficient marine food sources,” due to loss of ice in the Arctic Circle.[3] In addition some studies have already documented negative impacts of sea ice loss, including lower survival rates, in polar bear subpopulations.[8-9]
How climate change impacts the Arctic and Antarctic
Moore also claims that “this past winter in the Arctic saw an expansion of ice from previous years, and Antarctica was colder during the last winter than in the past 50 years.”
Scientists keep records on Arctic sea ice minimums (the lowest amount of cover that the sea ice reaches in summer) and maximums (the highest amount of cover sea ice reaches in winter). This February, the region’s winter sea ice extent was the 10th-lowest in the satellite record maintained by the National Snow and Ice Data Center. Though it’s true that that’s a slightly higher cover than last year – which ranked 7th-lowest in the satellite record – Arctic sea ice extent has been trending downwards since reliable satellite record keeping began in 1979, with minimum extents declining at about 13% per decade.[4]
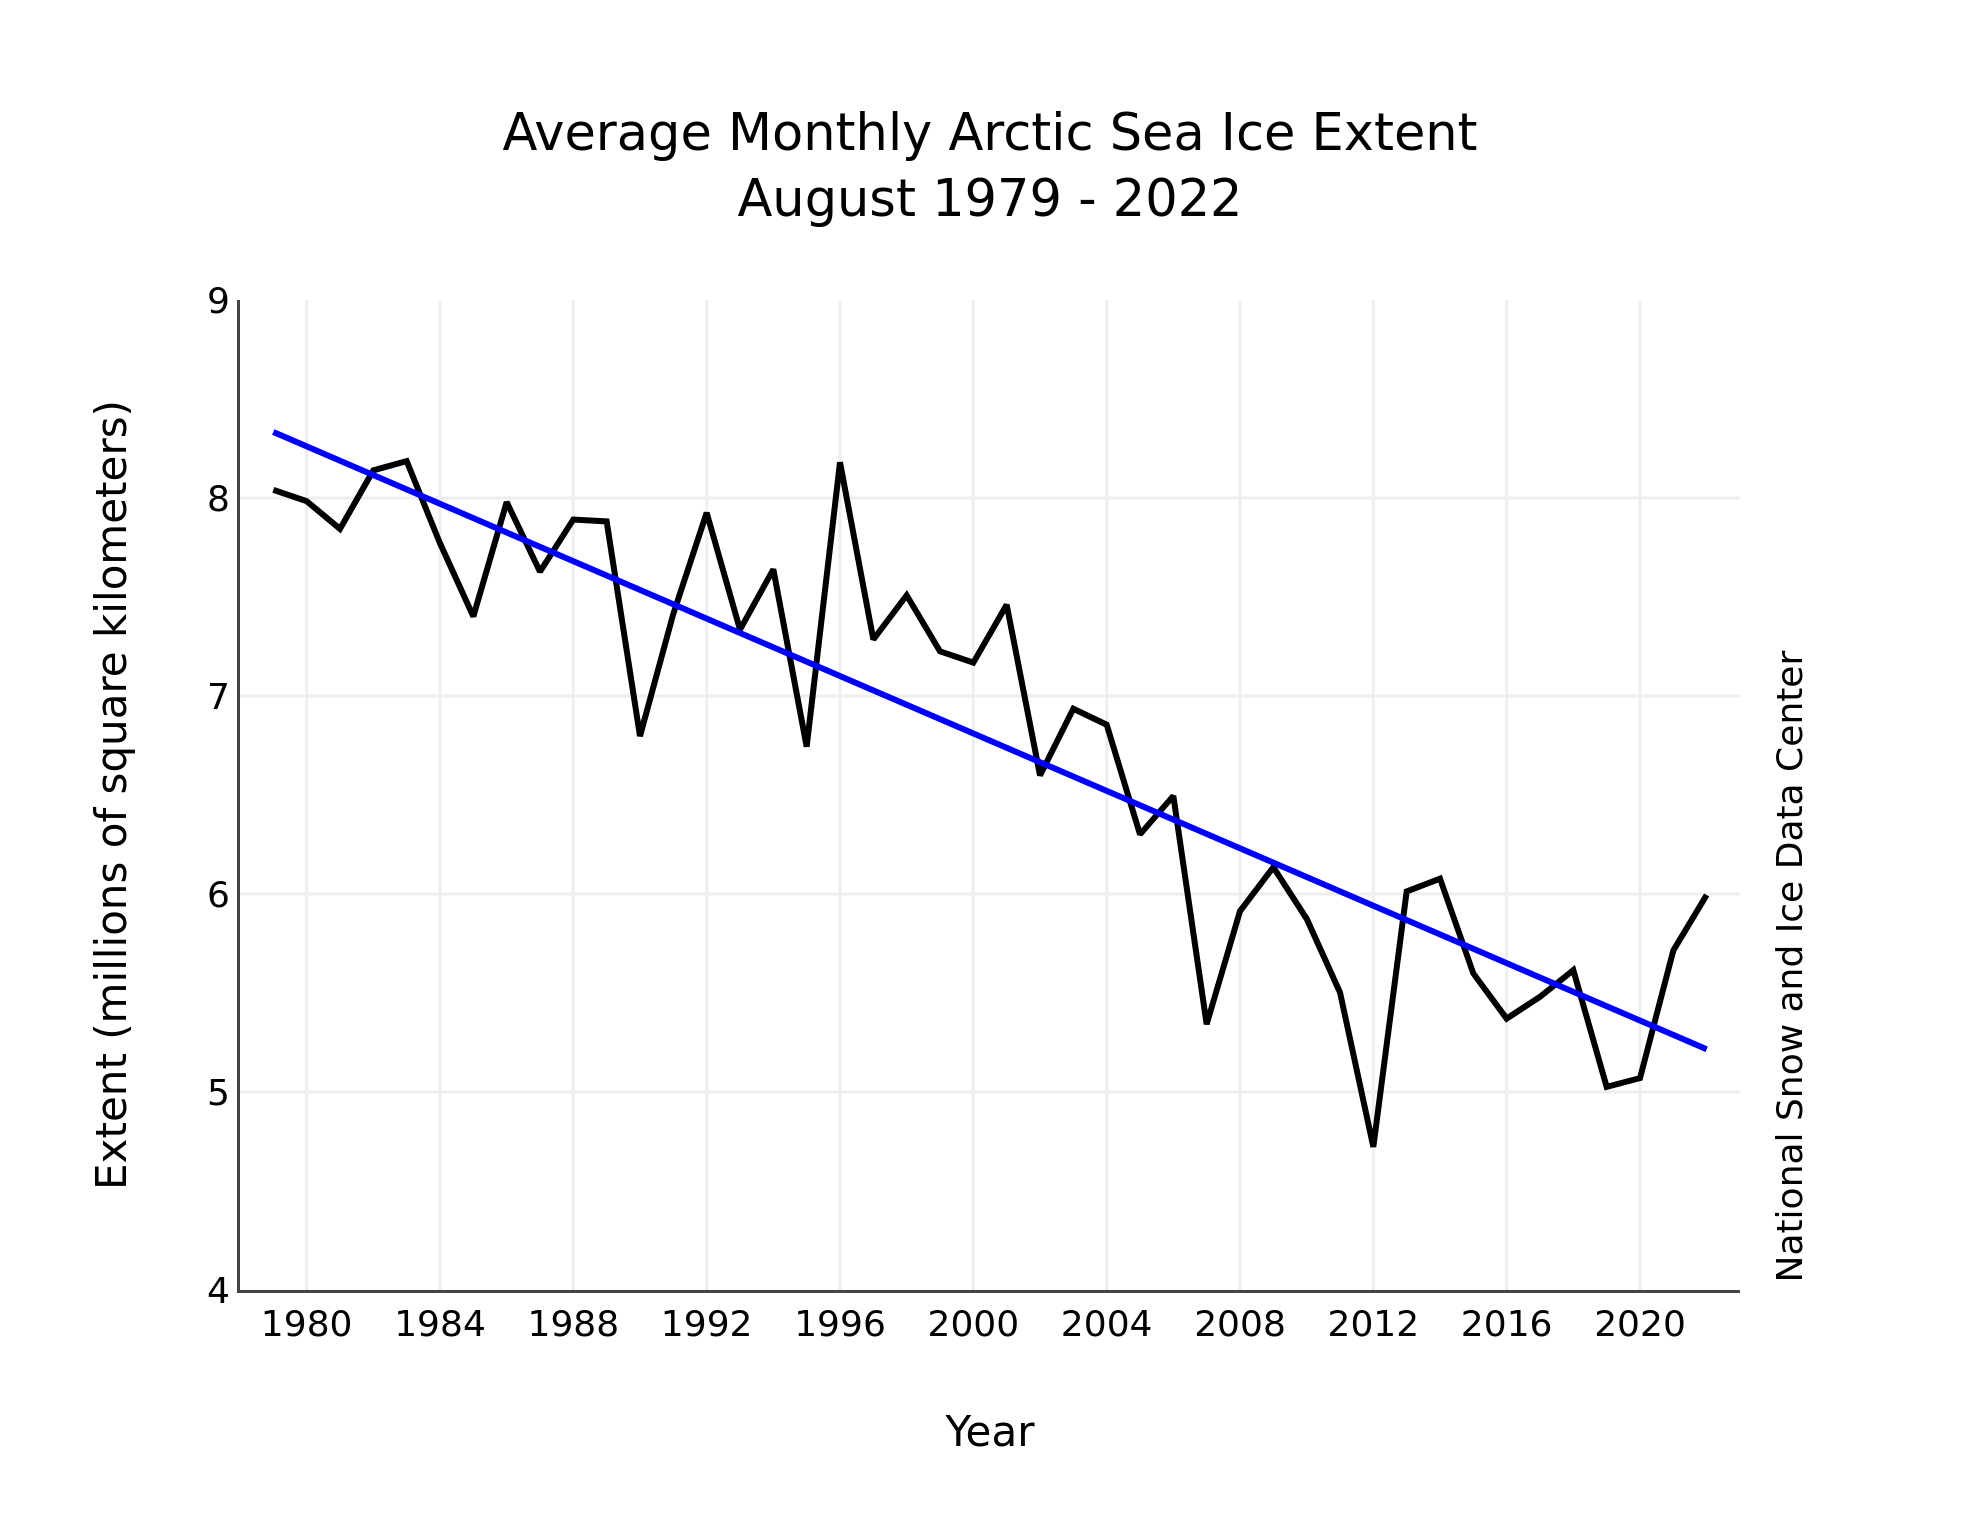
Figure 1: Graph shows decline in August Arctic sea ice extent from 1979 – 2022. Credit: National Snow and Ice Data Center.
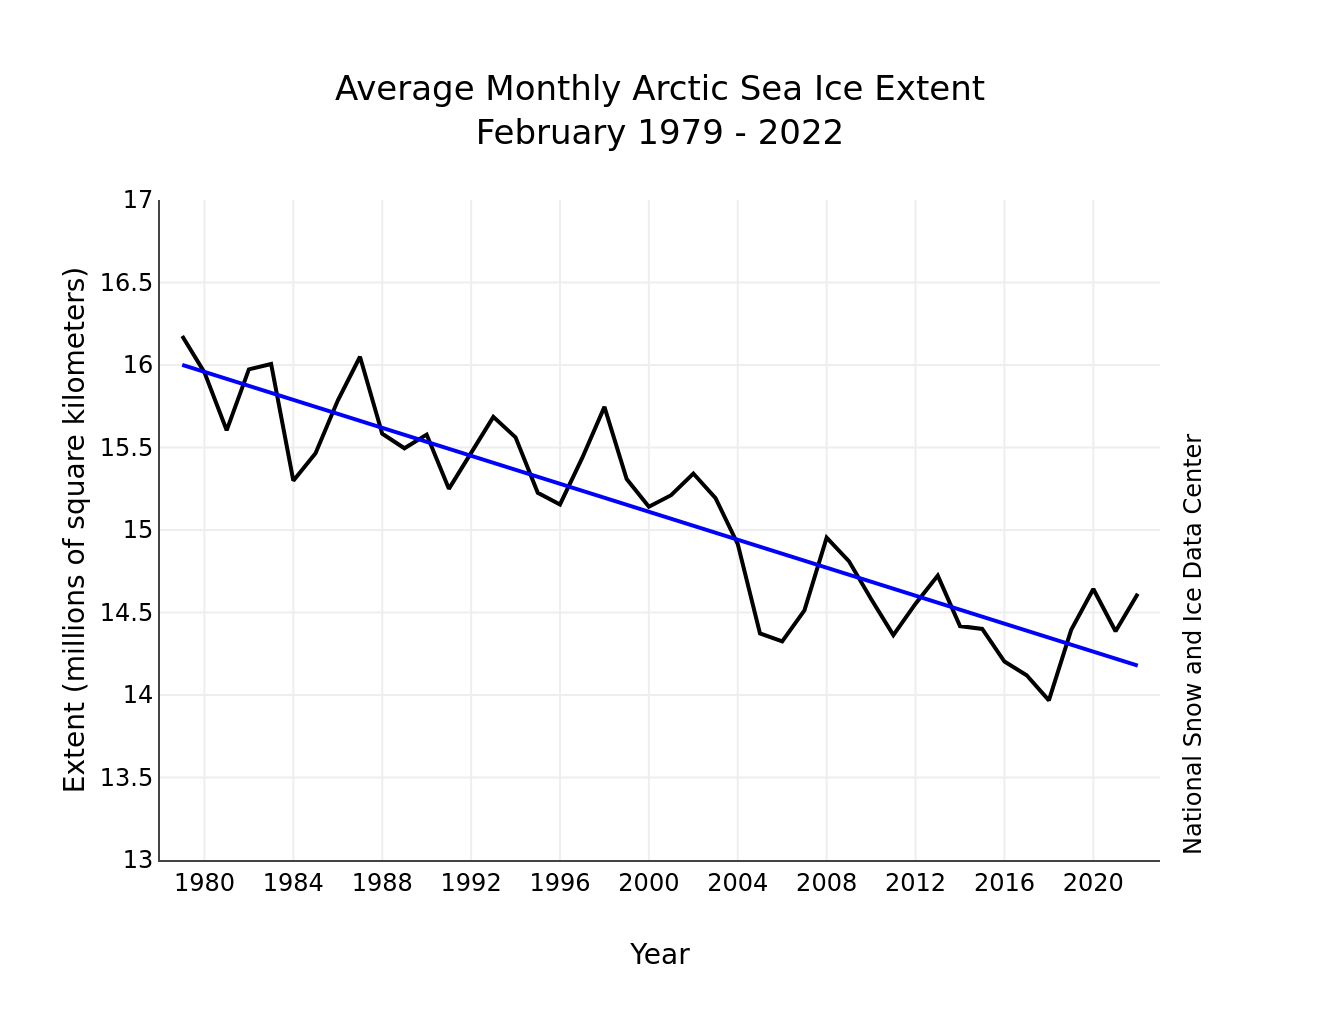
Figure 2: Graph shows decline in average February sea ice extent from 1979 – 2022. Credit: National Snow and Ice Data Center.
The Amundsen-Scott South Pole Station did experience a record-cold six-month stretch between April and September 2021. As Reuters notes in a 2021 fact-check, however, this six-month period does not invalidate the decades of data on global planetary temperature trends. Climate change’s impact on Antarctica also differs greatly from its impact on the Arctic, a fact that scientists are still working to understand. While sea ice thickness and extent has declined over the last few decades, sea ice in Antarctica has remained stable. There are numerous contributing factors to this dichotomy, including differences in geography, wind strength and ice thickness between the two regions, but the differences do not cast doubt on the globe’s overall warming trend. In addition, the sea ice loss trends in the Arctic dwarf the slight growth trends Antarctica experienced up until 2014.
“Looking at the trend in annual mean ice extent over the full period we have satellite data for (1979 to the end of 2021), the trends in the Antarctic are nearly ten times smaller than those in the Arctic (as well as being positive, not negative),” Caroline Holmes, Polar Climate Scientist at the British Antarctic Survey, said in a previous Climate Feedback review. “This is a fair comparison, as the average ice extent over those periods is similar.”
CO2: A known driver of climate change
Moore also claims that “the world has been warming since about the year 1700, 150 years before we were using fossil fuels.” He also references the Little Ice Age and Medieval Warm Period, which research has suggested were both prompted by natural causes: The Medieval Warm Period was driven largely by an increase in solar radiation and decrease in volcanic eruptions, while the Little Ice Age may have been triggered by warm Atlantic water entering the Nordic seas.[10] However, one study examined the Little Ice Age and Medieval Warm Period and found that the time periods were not as “globally coherent” as previously assumed, and could be considered more regional climate events.[11] The study states:
“Against this regional framing, perhaps our most striking result is the exceptional spatiotemporal coherence during the warming of the twentieth century. This result provides further evidence of the unprecedented nature of anthropogenic global warming in the context of the past 2,000 years.”
Moore cast doubt on the consensus that current rates of climate change are being driven by Carbon Dioxide and other greenhouse gases. He provided a graphic of CO2 levels graphed against temperatures in Central England and noted: “If carbon dioxide was the main cause of warming, then there should be a rise in temperature along the carbon dioxide curve, but it doesn’t.”
In reality, global records show a clear link between increasing levels of Carbon Dioxide and increasing temperatures. They also show that this current rate of temperature increase is far faster than past changes in temperature.

Figure 3: Yearly temperature compared to the twentieth-century average (red and blue bars) from 1880–2019, based on data from NOAA NCEI, plus atmospheric carbon dioxide concentrations (gray line): 1880-1958 from IAC, 1959-2019 from NOAA ESRL. Original graph by Dr. Howard Diamond (NOAA ARL), and adapted by NOAA Climate.gov. Caption credit: Climate.gov.
According to NASA, industrial activities “have raised atmospheric carbon dioxide levels by nearly 50% since 1750.” Scientists know that the CO2 building up in the Earth’s atmosphere is from human activities because of its isotopic fingerprint, which indicates that the CO2 originated from ancient plant material – i.e. fossil fuels.
Accurate global temperature records date back to 1880, with temperature data from years prior to 1880 estimated using “proxies” – things like tree rings and fossilized pollen. Research has traced human-caused warming to the 1830s – towards the end of the industrial era, which began in the mid 1750s.[5] The preindustrial era, which is hard to define definitely but which one study set as 1720–1800, was “0.55°–0.80°C cooler than 1986–2005 and that 2015 was likely the first year in which global average temperature was more than 1°C above preindustrial levels.”[6]
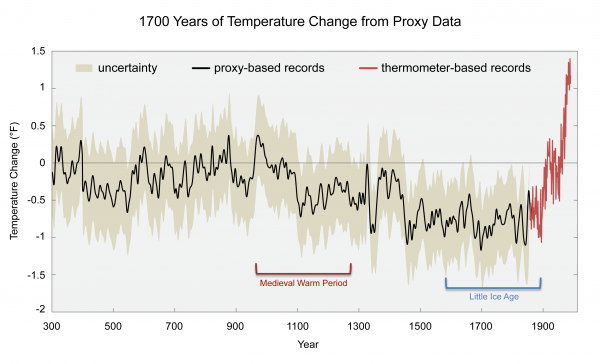
Figure 3: Changes in the temperature of the Northern Hemisphere from surface observations (in red) and from proxies (in black; uncertainty range represented by shading) relative to 1961-1990 average temperature. These analyses suggest that current temperatures are higher than seen globally in at least the last 1700 years, and that the last decade (2001 to 2010) was the warmest decade on record. (Figure source: adapted from Mann et al. 2008). Caption and graphic Courtesy globalchange.gov.
Moore references research that has found that excess levels of CO2 in the atmosphere can lead to global greening – an increase of leaf cover across the planet. Research does support this claim: A 2016 study, for instance, found that from 1982–2009, the globe showed “a persistent and widespread increase of growing season integrated LAI [Leaf Area Index] (greening) over 25% to 50% of the global vegetated area.”[7] But, as Climate Feedback explained earlier this year, that doesn’t mean that CO2 is harmless.
“The benefit[s] of increasing CO2 concentrations for plant growth are increasingly being outweighed by the negative impacts, especially of global warming,” Sara Vicca, assistant professor at the University of Antwerp, told Climate Feedback in a previous review. “This is true for natural as well as agricultural ecosystems.”
Science Feedback has reviewed inaccurate claims by Patrick Moore about climate change’s causes before. As cataloged by Open Feedback, the Epoch Times has been shown to have published misinformation in the past.
Update: A previous version of this post stated that Arctic sea ice maximums were declining by 13% per decade. In fact, Arctic sea ice minimums are declining by 13% per decade, while maximums are declining by about 2.8% per decade. This post has been updated to reflect this fact.
References
- [1] Wiig et al. (2015) Ursus maritimus. The IUCN Red List of Threatened Species.
- [2] Molnár et al. (2020) Fasting season length sets temporal limits for global polar bear persistence. Nature Climate Change.
- [3] Newton et al. (2021). Defining the “Ice Shed” of the Arctic Ocean’s Last Ice Area and Its Future Evolution. Earth’s Future.
- [4] How is Arctic sea ice changing? (2020). National Snow and Ice Data Center.
- [5] Abram et al. (2016) Early onset of industrial-era warming across the oceans and continents. Nature.
- [6] Hawkins et al. (2017) Estimating Changes in Global Temperature since the Preindustrial Period. Bulletin of the American Meteorological Society.
- [7] Zhu et al. (2008). Greening of the Earth and its drivers. Nature.
- [8] Lunn et al (2016) Demography of an apex predator at the edge of its range: impacts of changing sea ice on polar bears in Hudson Bay. Ecological Applications.
- [9] Regehr et al (2007) Effects of earlier sea ice breakup on survival and population size of polar bears in Western Hudson Bay. The Journal of Wildlife Management.
- [10] Lapointe et al. (2021) Little Ice Age abruptly triggered by intrusion of Atlantic waters into the Nordic Seas. Science Advances.
- [11] Neukom et al. (2019). No evidence for globally coherent warm and cold periods over the preindustrial Common Era. Nature.