

Incorrect: Ocean outgassing, which amplifies natural climate variations on timescales of hundreds-to-thousands of years, cannot explain the magnitude of the present-day atmospheric CO2 increase or the fact that ocean carbon has also been rapidly increasing since the beginning of the industrial era. Atmospheric measurements pinpoint fossil fuel emissions as the primary source of the rapid buildup of atmospheric CO2.

REVIEW
CLAIM: Human emissions could not be driving global warming since they are a small fraction of natural emissions. Temperature actually drives CO2, not the inverse. So the current rise in atmospheric CO2 is caused by ocean outgassing, not human emissions.
Dr. Ian Plimer, a former mining geologist, spoke at the Australian Conservative Political Action Conference (CPAC) in Sydney on 2 October 2022. A video clip of the talk was posted on Facebook a year later, and as of 1 December 2023, it has been liked over 5,200 times and shared over 3,700 times.
CLAIM 1 (Inaccurate):
“No one has ever shown that human emissions of CO2 drive global warming … and if it could be shown, then you would have to show that the 97% of emissions which are natural do not drive global warming.”
While anthropogenic fossil fuel carbon dioxide (CO2) emissions are indeed only a small fraction of annual natural emissions, they play a disproportionately powerful role in driving global warming. This may seem counterintuitive, but it becomes more apparent when we treat atmospheric CO2 as a stock-flow problem[1]. In this framework, the atmospheric CO2 content is the stock while the input and removal of CO2 to the atmosphere are the flows. The issue is that since the onset of the industrial era, human emissions have increased the input of CO2 to the atmosphere, whereas CO2 removal through natural processes has not increased to the same extent. The result of this annual flow imbalance is an increasing stock of atmospheric CO2, driving global warming.
The carbon cycle describes how carbon moves between different reservoirs or stocks in the earth system. On timescales up to millennia, the most important natural exchanges are between the atmosphere, ocean, and terrestrial biosphere. Each year, CO2 is released to the atmosphere through ecosystem respiration and fire, and a nearly equal amount is taken up through photosynthesis; there are also air-sea CO2 fluxes largely balanced in both directions. These processes were more or less in equilibrium in the two millennia before the industrial era such that atmospheric CO2 concentrations remained relatively stable (Fig. 1, top). Geologic exchanges typically occur on much longer timescales via sediment burial, volcanic outgassing, and rock weathering.
However, since the beginning of the industrial era, human activity through burning fossil fuels has rapidly released carbon stored in geologic reservoirs directly to the atmosphere, with emissions steadily increasing up to the present. Human-induced land-use changes (mainly deforestation) have also transferred carbon from the terrestrial biosphere to the atmosphere much more rapidly than pre-industrial conditions. Though natural removal processes of land and ocean CO2 uptake, or sequestration, have also steadily increased, they have not fully kept pace with increased emissions, taking up around 55% of the total anthropogenic perturbation[2].
The atmospheric CO2 stock reflects this net flow imbalance. Annually-averaged CO2 concentrations have risen without interruption since the beginning of atmospheric measurements in 1958, and the rate of increase is also growing[2,3]. Atmospheric CO2 concentrations have increased from approximately 278 parts per million (ppm; equivalent to 590 gigatons of carbon (GtC) as 1 ppm = 2.124 GtC) in 1750[2] to 417 ppm (886 GtC) in 2022 (Fig. 1, top)[3]. These concentrations are unprecedented in the last 2 million years, and the rate of CO2 increase over the past century is at least 10 times faster than at any other time during the last 800,000 years[4]. This CO2 increase is estimated to contribute to a global surface air temperature warming of 1.01°C since 1750 (90% confidence interval of 0.74°C to 1.41°C), the largest-magnitude climate perturbation over the industrial period[5].
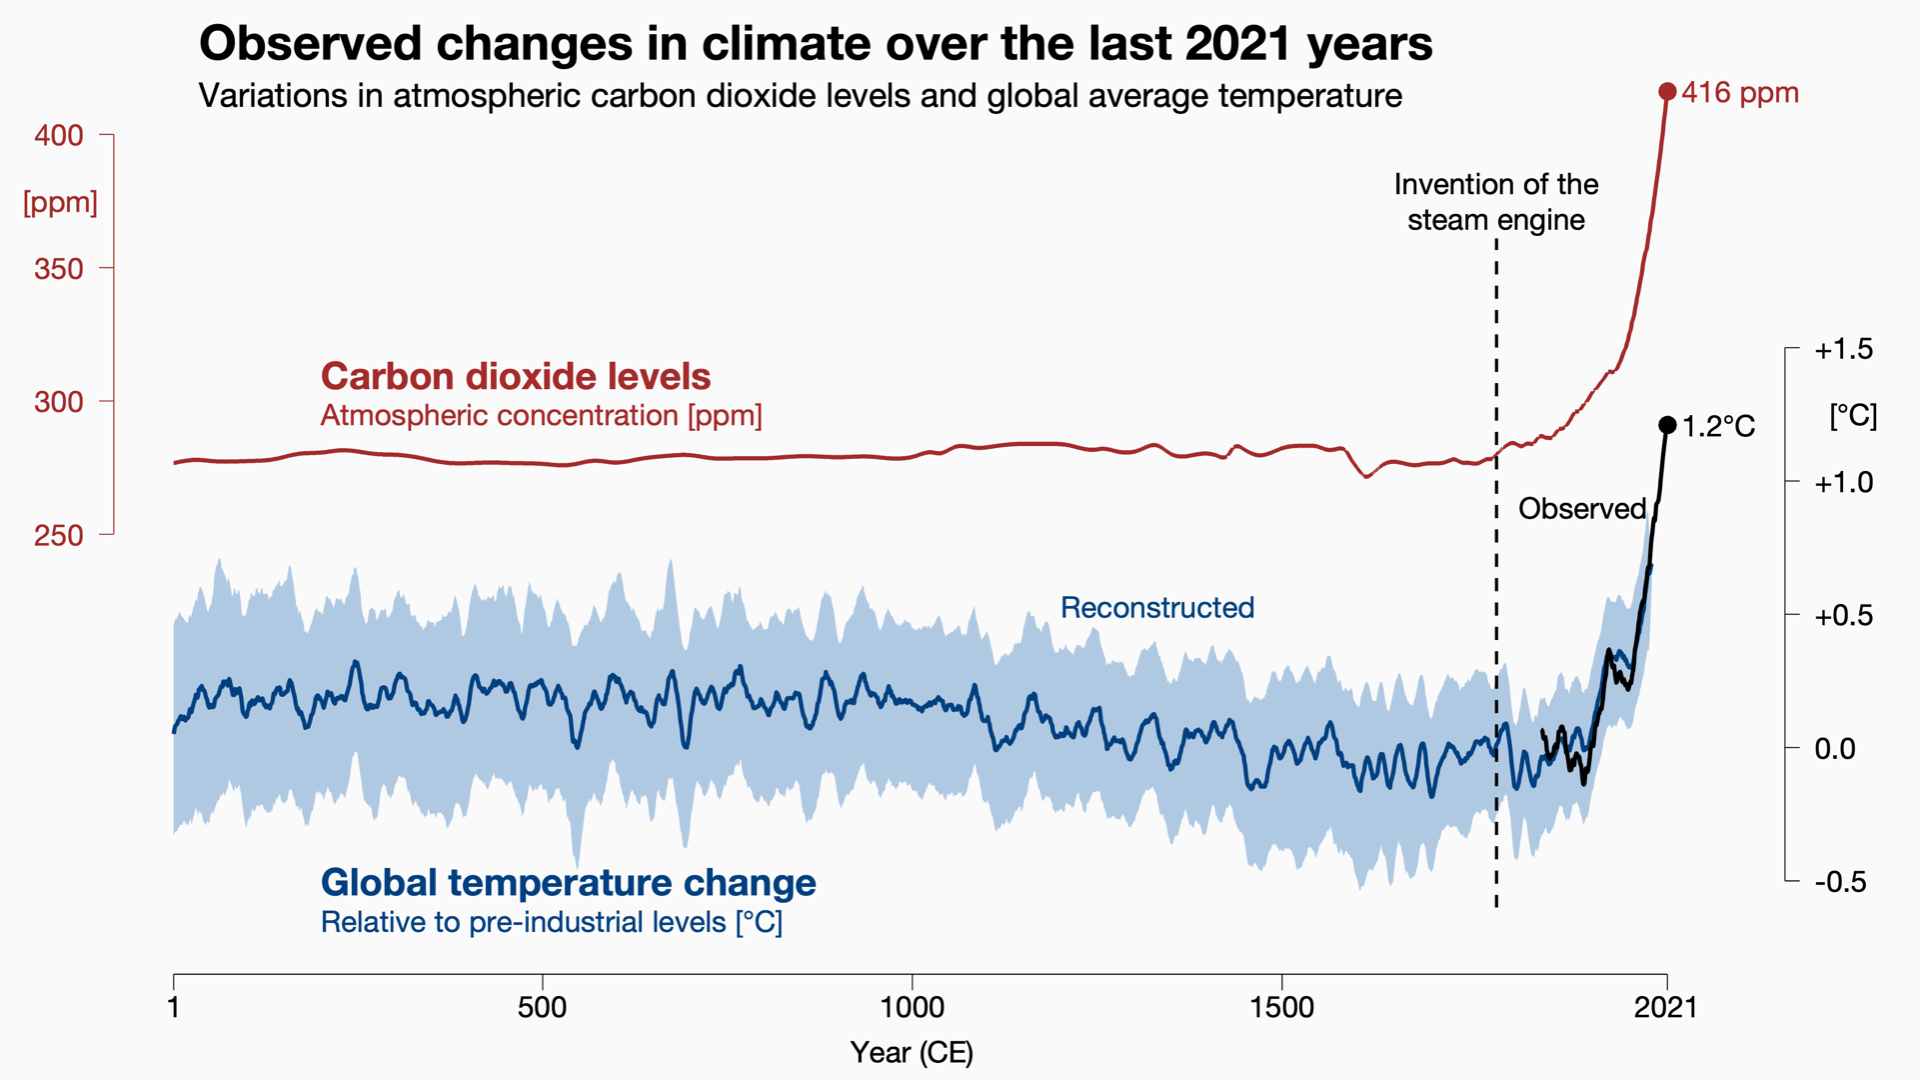
Figure 1 – Atmospheric CO2 concentrations (ppm, top) and global surface temperature anomaly (°C, bottom) over the past 2000 years. From Climate Lab Book.
For a more detailed picture, we can examine the specific flows between reservoirs causing the present-day atmospheric CO2 increase using a recent best-estimate assessment of the global carbon cycle for the 2012–2021 decade (Fig. 2)[2]. Average annual fossil fuel emissions over this period are estimated to be 9.6 GtC yr−1 (GtC per year). Dividing this value by the average annual CO2 fluxes from the land (130 GtC) and ocean (80 GtC) yields an estimate of a fossil fuel perturbation of around 4%, comparable to Dr. Plimer’s 3% value (they would be closer using older data as emissions have been increasing). Adding land-use changes (1.2 GtC yr−1) and subtracting sequestration by terrestrial (3.1 GtC yr−1) and marine (2.9 GtC yr−1) carbon sinks yields an average 2012–2021 atmospheric CO2 increase of 5.2 GtC yr−1, or 2.46 ppm yr−1.
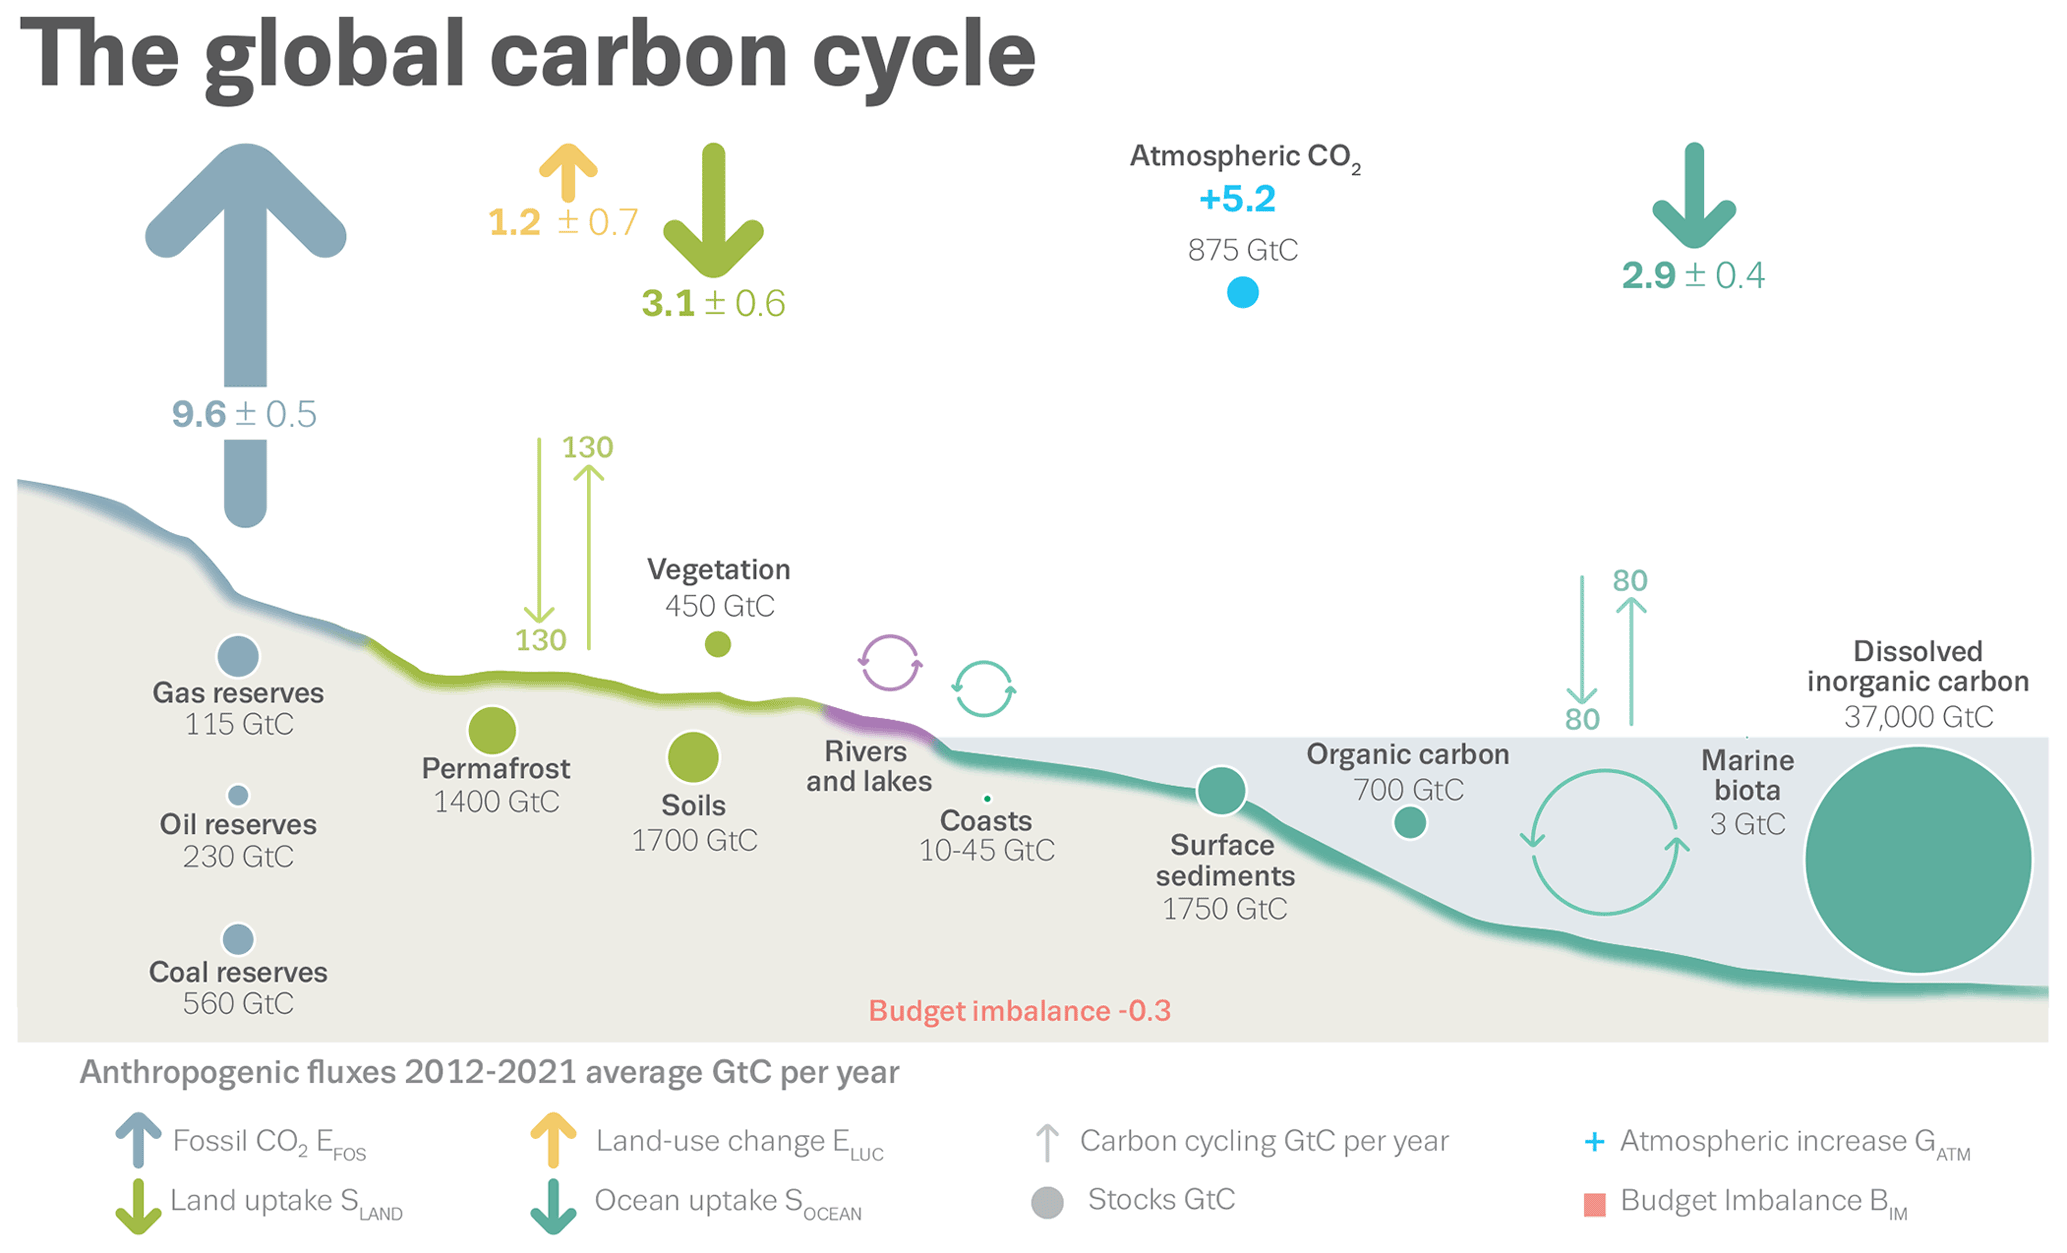
Figure 2 – Carbon cycle reservoirs (GtC, filled circles) and average annual fluxes (GtC yr−1, arrows) for 2012–2021 (from Figure 2 of reference 2). Thin arrows show the background natural carbon exchanges (estimated around 1750) and thick arrows show the anthropogenic perturbation.
CLAIM 2 (Incorrect):
“It’s not CO2 that drives temperature; it’s the exact inverse.” We’ve known for 200 years from chemistry the inverse solubility of CO2, that warm water holds less CO2 as it warms. “We see it from the ice cores … when we have natural warming, some 650–6000 years later we have an increase in CO2.”
In his second claim, Dr. Plimer posits that the present-day atmospheric CO2 increase is from the ocean releasing CO2 in response to past natural warming, not human emissions. However, this claim fundamentally overlooks multiple sources of evidence showing a massive influx of anthropogenic CO2 to the climate system. While the ocean does respond to warmer temperatures by outgassing CO2 during glacial-interglacial transitions on timescales of hundreds-to-thousands of years, this mechanism does not explain observations of the rapid and unprecedented rise of atmospheric CO2 concentrations since the onset of the industrial era.
The ocean reservoir contains tremendous amounts of dissolved carbon (Fig. 2, circles), owing to the chemistry of CO2 in seawater which allows it to be partitioned across different ions[6]. Like many gases, the solubility of CO2 decreases with temperature, which indeed has been known for over 200 years[7]. A consequence of this inverse solubility relationship is that the ocean is able to hold less carbon as it warms, assuming other conditions are held fixed[6]. This mechanism contributes to amplifying high-latitude temperature changes on timescales of hundreds-to-thousands of years. Due to the slow timescales of deep ocean circulation, the ocean takes centuries to equilibrate to the initial surface temperature perturbation. For example, recent paleoclimate studies indicate that Antarctic temperatures generally precede atmospheric CO2 changes by around 500–650 years (90% confidence interval) during glacial-interglacial transitions, at the far low end of Dr. Plimer’s range[4],[8].
Though important for paleoclimate variations, this mechanism is unable to account for the recent staggering rise of atmospheric CO2 (Fig. 3), which has reached levels unprecedented over the last 2 million years and is increasing at least 10 times faster than at any other time during the last 800,000 years[4]. Moreover, the several centuries prior to the rapid rise of atmospheric CO2 in the industrial era featured slight global cooling[9] (Fig. 1, bottom), contrary to Dr. Plimer’s hypothesized warming.
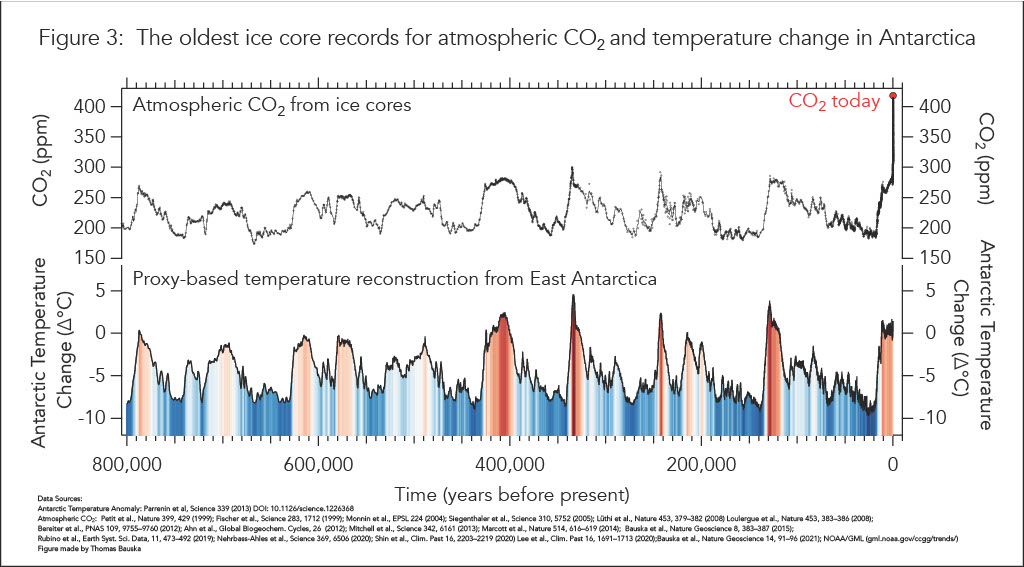
Figure 3 – Atmospheric CO2 concentrations (ppm, top) and Antarctic temperature anomaly (°C, bottom) over the past 800,000 years. From British Antarctic Survey.
A glaring problem with Dr. Plimer’s claim is that ocean carbon has been increasing since the industrial era. The schematic Fig. 4 shows a recent best-estimate assessment of the anthropogenic global carbon cycle perturbation for cumulative 1850–2021 changes (left side) and average fluxes over the 2012–2021 decade (right side)[2]. For cumulative 1850–2021 changes (left side), ocean carbon content – estimated from several ocean biogeochemistry models and observation-based data products – increased by 175±35 GtC (mean±1 standard deviation). During that time, total emissions from fossil fuels and land-use change were 670±65 GtC, while atmospheric CO2 concentrations increased by only 275±5 GtC and terrestrial carbon storage by 210±45 GtC. Even considering uncertainties, it would be extremely difficult to close the remaining carbon imbalance without ocean CO2 uptake. Average fluxes for the recent 2012–2021 period (right side) indicate that the rate of ocean carbon sequestration has increased, with uptake rates almost 3 times faster than the 1850–2021 average.
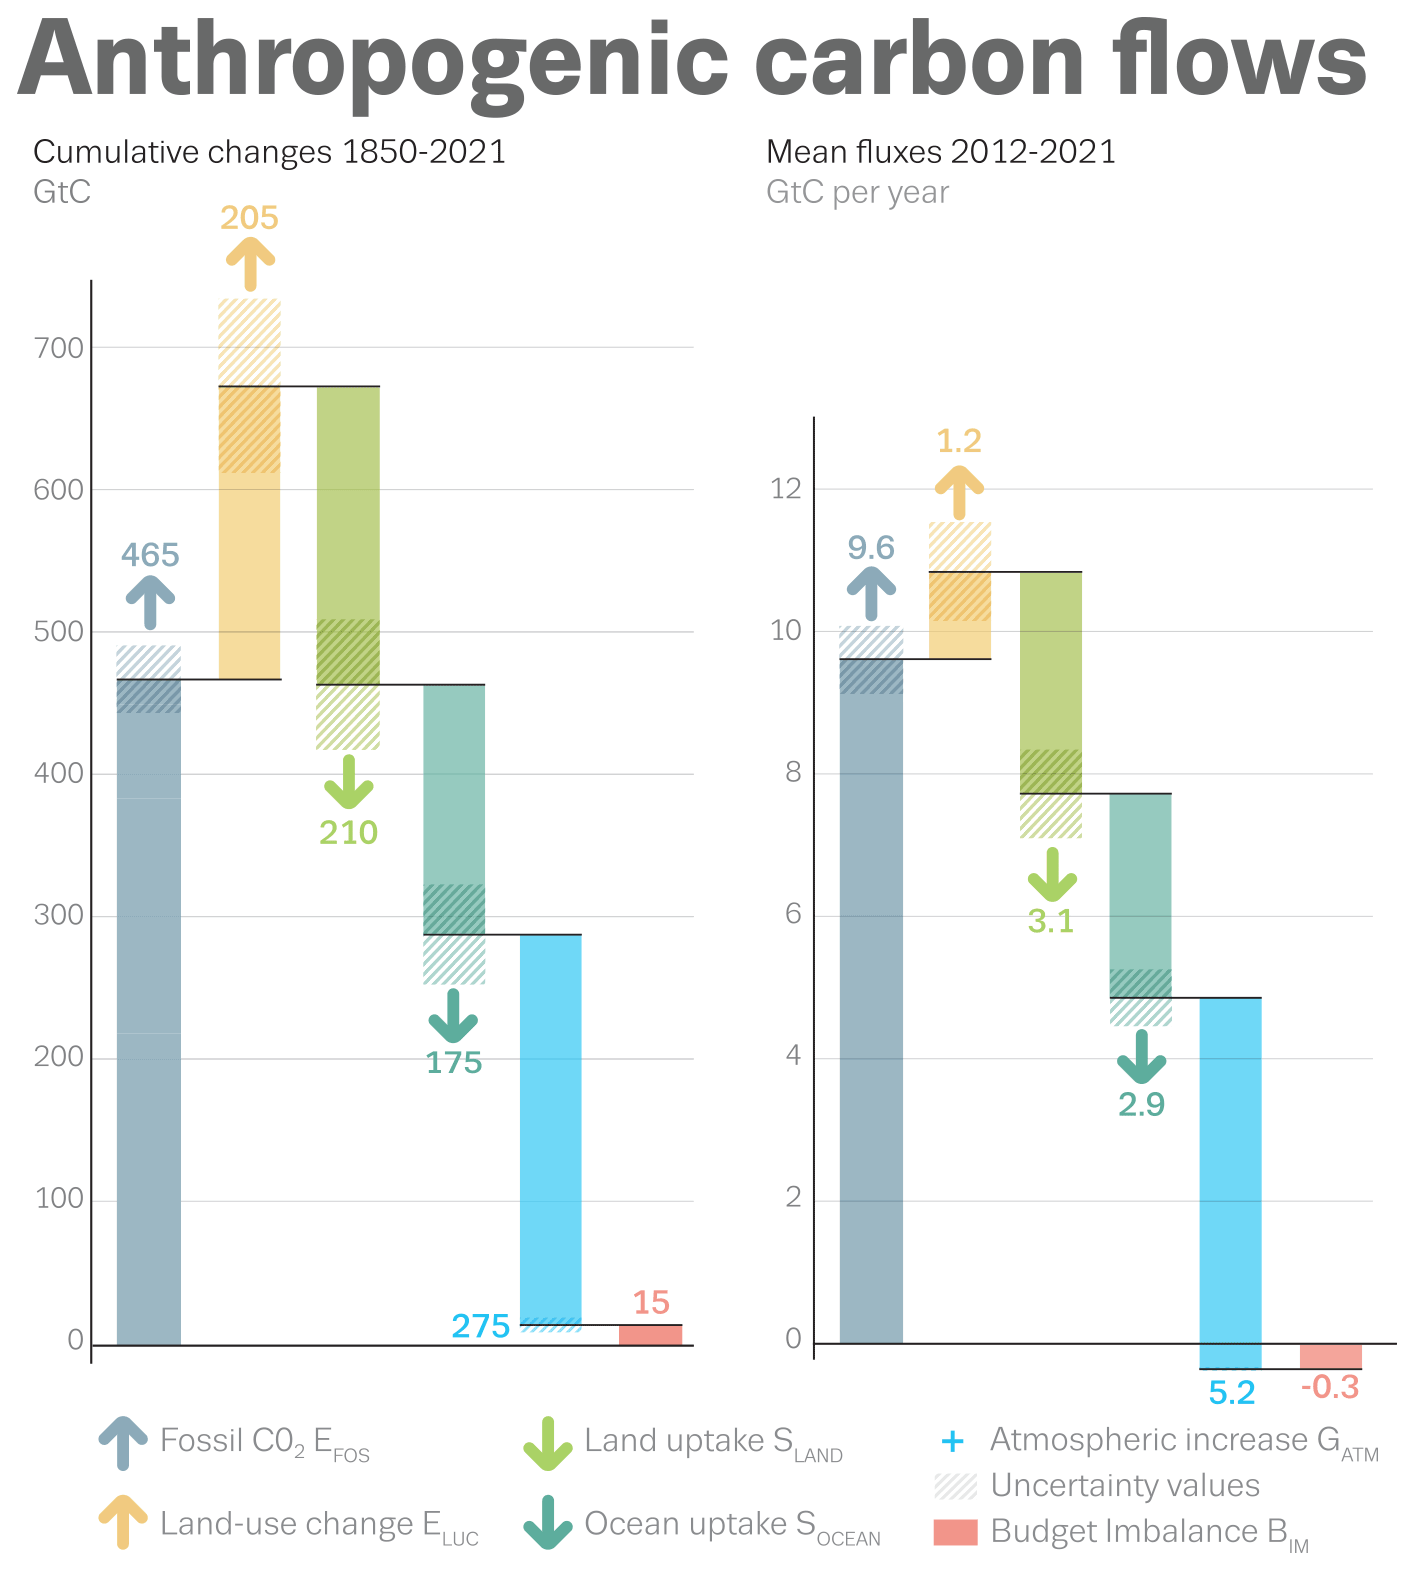
Figure 4 – Anthropogenic global carbon cycle perturbation (from Figure 14 of reference 2). Left: cumulative 1850–2021 changes (GtC). Right: average fluxes over 2012–2021 (GtC yr−1); note that these correspond to the thick arrows in Figure 2.
Several atmospheric measurements provide further corroboration that human emissions are the source of rising global atmospheric CO2 concentrations[4],[10]. Figure 5, top, shows observations of monthly CO2 concentrations at Mauna Loa Observatory and the South Pole, with concentrations at both stations continuously increasing since measurements began in the late-1950s. Another feature is that CO2 concentrations at Mauna Loa have increased by a few ppm compared to the South Pole, indicating higher CO2 input from the land-dominated northern hemisphere, where most industrialized regions are located. Furthermore, measured atmospheric oxygen (O2) concentrations have been steadily decreasing globally since regular observations began around 1990 (Fig. 5, bottom). Atmospheric O2 concentrations are not affected by ocean CO2 outgassing, so the decreasing O2 concentrations indicate that increasing atmospheric CO2 is primarily driven by an oxygen-consuming process, namely combustion, but also respiration.
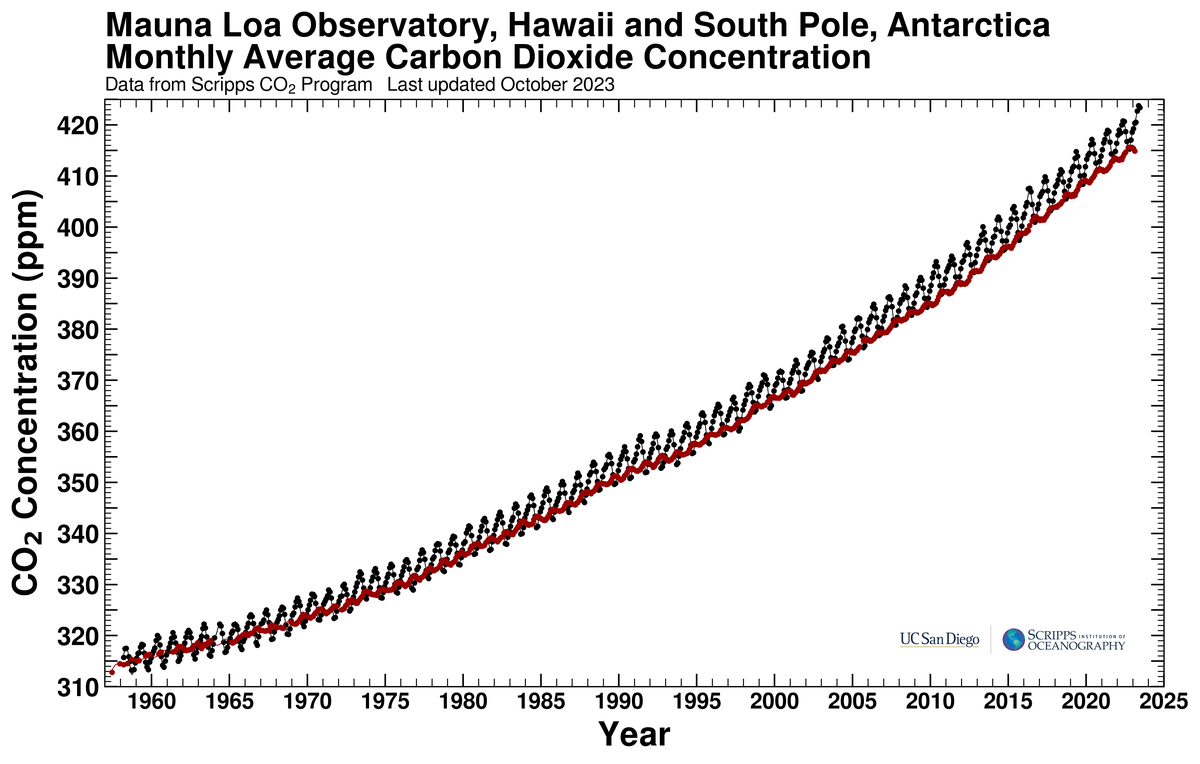
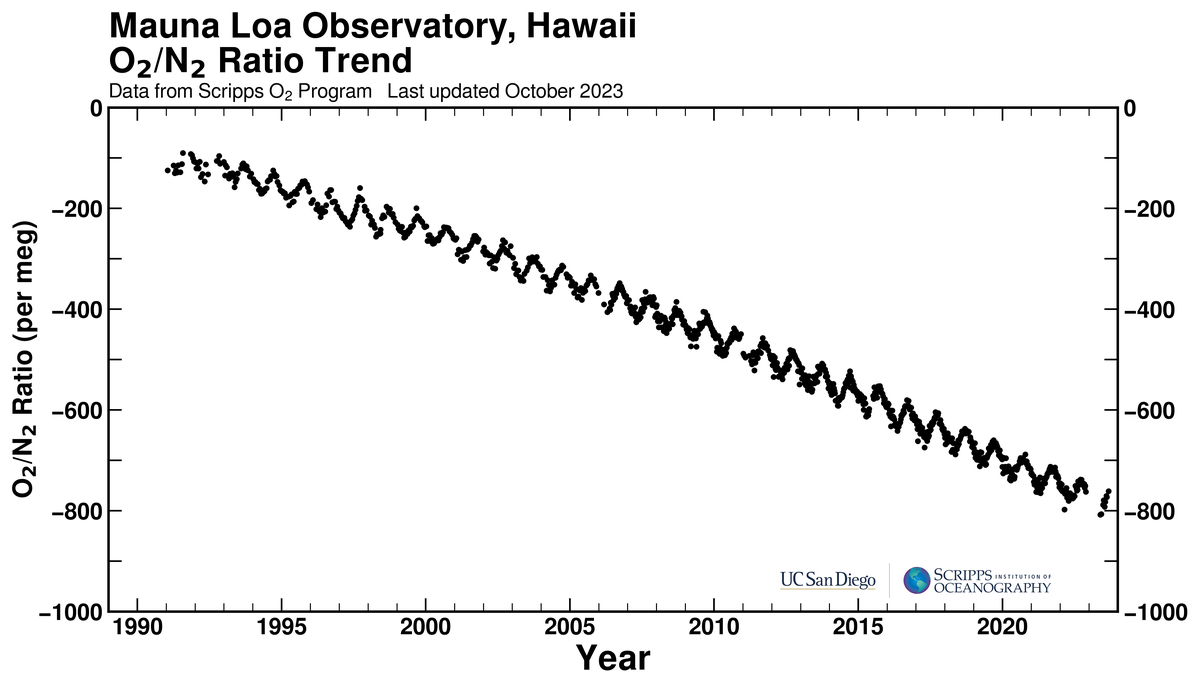
Figure 5 – Top: Monthly average atmospheric CO2 concentration (ppm) at Mauna Loa Observatory, Hawaii (black) and South Pole (red). From Scripps CO2 program. Bottom: Atmospheric O2 concentrations (expressed as the O2/N2 ratio) at Mauna Loa Observatory. From Scripps O2 Program.
Isotope measurements provide additional evidence for a fossil fuel source of increased atmospheric CO2 concentrations[10],[11]. Carbon has two stable isotopes: around 99% exists as carbon-12 (12C) and 1% as carbon-13 (13C). Plants preferentially take up 12C through photosynthesis, so plants and fossil fuels (which are derived from organic matter) are enriched in 12C compared to atmospheric CO2. The global 13C/12C ratio has been decreasing since atmospheric measurements began in the late-1970s (Fig. 6), indicating a plant or fossil fuel source of increasing atmospheric CO2. Furthermore, the unstable radioactive isotope carbon-14 (14C or radiocarbon) is naturally produced in extremely small amounts in the upper atmosphere and is absent from fossil fuels. There has been a long-term decrease in the 14C/12C ratio (interrupted by a pulse from atmospheric nuclear testing), indicating an enhanced 12C source from fossil fuel emissions.
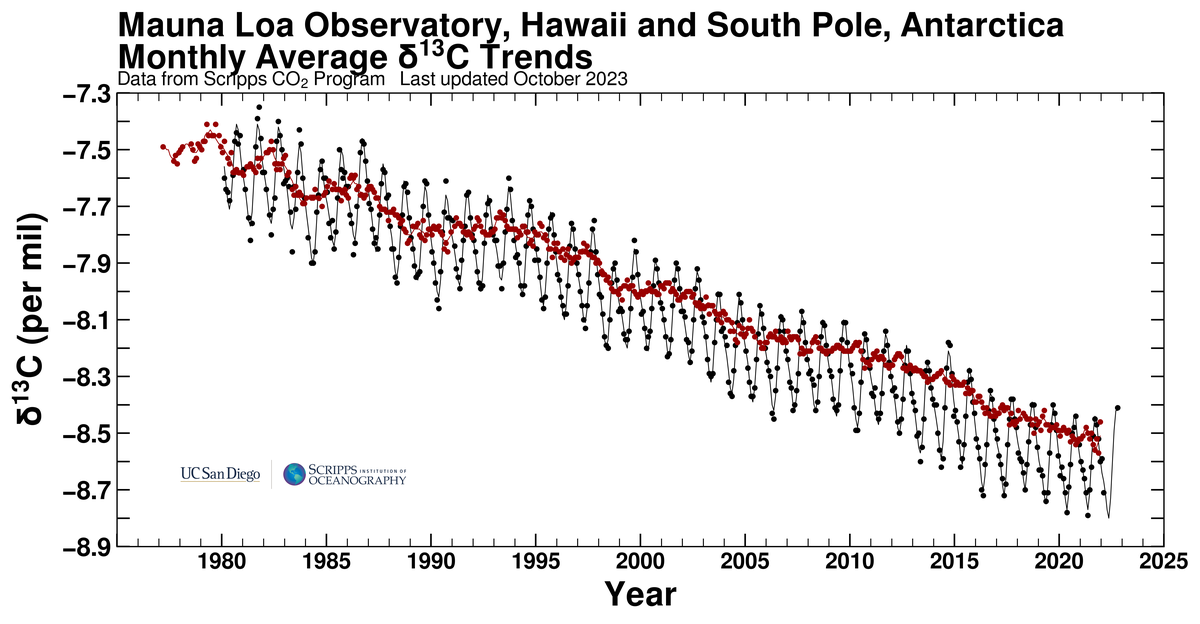
Figure 6 – Monthly average 13C/12C ratio (expressed as δ13C) at Mauna Loa Observatory (black) and South Pole (red). From Scripps CO2 program.
Conclusion
Dr. Plimer’s claims are incorrect and inaccurate. Overwhelming evidence from carbon budget accounting and atmospheric measurements implicate anthropogenic fossil fuel burning as the main source of the present-day atmospheric CO2 increase. Though relatively small on an annual basis compared to natural fluxes, the steady input of anthropogenic CO2 emissions with only partial removal from natural carbon sinks has resulted in an unparalleled increase of atmospheric CO2 concentrations since the onset of the industrial era. The scientific consensus and evidence for the clear links between human CO2 emissions, the greenhouse effect, and global warming have also been recently addressed in another claim review of Science Feedback. Trends in atmospheric measurements, such as CO2 concentrations increasing faster in the northern hemisphere, decreasing O2 concentrations, and decreasing 13C/12C and 14C/12C ratios, can only be explained by emissions from fossil fuel combustion in the industrialized northern hemisphere.
REFERENCES
- 1 – Grantham Research Institute on Climate Change and the Environment (2022) Why does climate change get described as a stock-flow problem?
- 2 – Friedlingstein et al. (2022) Global Carbon Budget 2022. Earth System Science Data
- 3 – Lan et al. (2023) Trends in globally-averaged CO2 determined from NOAA Global Monitoring Laboratory measurements
- 4 – IPCC (2021) Global Carbon and other Biogeochemical Cycles and Feedbacks. In Climate Change 2021: The Physical Science Basis. Contribution of Working Group I to the Sixth Assessment Report of the Intergovernmental Panel on Climate Change
- 5 – IPCC (2021) The Earth’s Energy Budget, Climate Feedbacks, and Climate Sensitivity. In Climate Change 2021: The Physical Science Basis. Contribution of Working Group I to the Sixth Assessment Report of the Intergovernmental Panel on Climate Change
- 6 – DeVries (2022) The Ocean Carbon Cycle. Annual Review of Environment and Resources
- 7 – Henry (1803) Experiments on the quantity of gases absorbed by water, at different temperatures, and under different pressures. Philosophical Transactions of the Royal Society of London
- 8 – Bauska et al. (2021) Abrupt changes in the global carbon cycle during the last glacial period. Nature Geoscience
- 9 – IPCC (2021) Changing State of the Climate System. In Climate Change 2021: The Physical Science Basis. Contribution of Working Group I to the Sixth Assessment Report of the Intergovernmental Panel on Climate Change
- 10 – Keeling and Graven (2021) Insights from Time Series of Atmospheric Carbon Dioxide and Related Tracers. Annual Review of Environment and Resources
- 11 – Graven et al. (2022) Radiocarbon dating: going back in time. Nature