
Former Australian Prime Minister Tony Abbott recently gave a speech at a climate “skeptic” conference hosted by the UK Global Warming Policy Foundation (led by Nigel Lawson who recently made incorrect claims about temperature evolution in a BBC interview). Abbott’s speech included claims about several aspects of climate science—claims that, according to scientists, were not accurate.
Professor Steve Sherwood, deputy director of the University of New South Wales Climate Change Research Centre described the speech as “the usual mix of misdirection, falsehoods and tirades against ‘brigades’ who supposedly say this and that but are never clearly identified”.
In his speech, Abbott repeated common climate change contrarian talking points that are either incorrect, fallacious, unsupported, misleading, or cherry-picked. Read below for detailed reactions from scientists.
On top of being often erroneous, Abbott’s speech was internally inconsistent, as The Guardian’s Graham Readfern explained. “[Abbott] described carbon dioxide as a ‘trace gas’ and dismissed its role in warming, but elsewhere thought warming (which might not be happening) would be good. And the ‘trace gas’ is insignificant, but not when it comes to its ability to ‘green the planet’ and help plants grow.”
Just as a house cannot be solidly built on a foundation of sand, whatever policy Abbott advocates for falls down since it relies on false premises.
SCIENTISTS’ FEEDBACK
Below is a list of quotes from Tony Abbott’s speech with scientists’ responses.
CLAIM: “the evidence suggests that sun spot cycles and oscillations in the Earth’s orbit are at least as important for climate change [as CO2]”
This claim is incorrect for current climate change, as explained here. What is correct is that oscillations in the Earth’s orbit have played a major role in past climate changes, but these oscillations play out on much longer timescales (thousands of years) and cannot explain the observed increase in temperature over the past century.
Timothy Osborn, Professor, University of East Anglia, and Director of Research, Climatic Research Unit:
There is strong evidence that solar forcing cannot explain much of the observed warming at all. The “fingerprint” of solar forcing does not match the observed changes at all, neither over time nor space. Solar forcing would warm both the stratosphere and the surface of the Earth, whereas CO2 warms the surface (and the troposphere) but cools the stratosphere. Using radiosondes and (more recently) satellites, we have observed a warming surface and troposphere together with a cooling stratosphere. See Santer et al (2013)* for one of many studies providing this evidence.
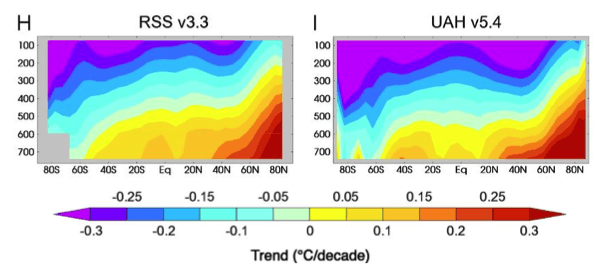 Figure – Zonal-mean atmospheric temperature trends in satellite observations from January 1979 to December 2012 showing warming of the lower atmosphere (troposphere) and cooling of the upper-atmosphere (stratosphere), from Santer et al (2013)*
- Santer et al (2013) Human and natural influences on the changing thermal structure of the atmosphere, PNAS
CLAIM: “Then there’s the evidence that higher concentrations of carbon dioxide (which is a plant food after all) are actually greening the planet and helping to lift agricultural yields.”
The suggestion that the rising concentration of atmospheric CO2 is boosting crop yields is misleading. While plants do utilize CO2 for growth, the concentration of this gas is not the only constraint on their growth—and the climate change caused by additional CO2 has its own consequences for agriculture.
Martin De Kauwe, Senior Research Fellow, University of New South Wales:
Whilst it is true there is evidence of “greening” from satellite derived estimates, the argument that CO2 will make everything OK (“a plant food after all”) is simplistic. For example, Hochman et al* highlighted that grain yields have stalled in many developed countries. They attributed the stall (since 1990) in Australian wheat yield to the effect of climate (reduced precipitation and increased temperatures). The inferred positive effect of CO2 on yields was small (preventing a further 4% loss relative to 1990 yields) and was by far outweighed by the effect of technology advances.
- Hochman et al (2017) Climate trends account for stalled wheat yields in Australia since 1990, Global Change Biology
G Philip Robertson, Professor, Michigan State University:
[Comment from previous evaluation of a similar claim.]
In general, CO2 has had a positive effect on crop growth, but it’s impossible to separate historical effects from the greater effects of genetics and nitrogen and other inputs. However, it’s generally considered to be a fraction of those. We know better future effects because we have CO2 fertilization experiments in the field comparing present to future CO2 levels. Those experiments suggest that corn may have about a 1% gain [because of increased CO2] and soybeans 3-4 times that. However, these gains will almost certainly be offset by yield declines associated with the temperature increases caused by elevated CO2, which are well known.
Historically, it’s worth noting that we had elevated CO2 long before we had the green revolution, and crop yields didn’t increase much until the green revolution. You can see this in graphs of average US corn yields from 1900.
Source: University of Nebraska-Lincoln
Jean-François Exbrayat, Post-doctoral Research Fellow, The University of Edinburgh:
[Comment from previous evaluation of a similar claim.]
Carbon dioxide is a gas that is naturally present in the atmosphere. Plants grow by taking up CO2 from the atmosphere through the process of photosynthesis. Terrestrial ecosystems have taken up about 20-30% of fossil-fuel emissions since the 1960s[1]. Through this so-called “CO2-fertilization”, plants help reduce the growth of atmospheric CO2 responsible for climate change, and this might be what William Happer refers to when talking about greening.
A global “greening”, (i.e., longer growing seasons) of the Earth has also been detected in satellite observations of leaf area index from the 1980s to the present day, and modelling experiments have attributed 70% of this greening to CO2 fertilization[2].
However, plants grow better with more CO2 only if they also have access to nutrients like nitrogen and phosphorus to fix the photosynthesised carbon. For example, results from Free-Air CO2 Enrichment (FACE) experiments[3] have shown that the initial enhancement of plant productivity under CO2-fertilization was declining through time. This enhancement could, however, be restored and maintained through an additional nitrogen treatment. Results from another FACE experiment in Australia[4] have recently shown that, under current phosphorus limitations, no additional growth was recorded under increased CO2.
These results from FACE experiments raise uncertainty on the sustainability of the CO2-fertilization effect in mostly nitrogen-limited temperate and boreal forests and mostly phosphorus-limited tropical ecosystems. Accordingly, adding nitrogen and phosphorus limitations on plant growth in Earth system models reduces the projected capacity of the land surface to continue offsetting fossil-fuel emissions during the 21st century[5].
- [1] Le Quéré et al (2016) Global Carbon Budget 2016, Earth System Science Data
- [2] Zhu et al (2016) Greening of the Earth and its drivers, Nature Climate Change
- [3] Norby et al (2010) CO2 enhancement of forest productivity constrained by limited nitrogen availability, PNAS
- [4] Ellsworth et al (2017) Elevated CO2 does not increase eucalypt forest productivity on a low-phosphorus soil, Nature Climate Change
- [5] Wieder et al (2015) Future productivity and carbon storage limited by terrestrial nutrient availability, Nature Geoscience
CLAIM: “In most countries, far more people die in cold snaps than in heat waves, so a gradual lift in global temperatures, especially if it’s accompanied by more prosperity and more capacity to adapt to change, might even be beneficial.”
Kristie Ebi, Professor, University of Washington:
[Comment from previous evaluation of a similar claim.]
It is true that mortality is higher during winter than summer. However, it does not follow that winter mortality is temperature-dependent (which summer mortality is). Dave Mills and I reviewed the evidence and concluded that only a small proportion of winter mortality is likely associated with temperature. A growing numbers of publications are exploring associations between weather and winter mortality, with differences in methods and results. The country with the strongest association between winter mortality and temperature is England, which appears in other publications to be at least partly due to cold housing. Winter mortality is lower in northern European countries.
Katrin Meissner, Professor, University of New South Wales:
[Comment from previous evaluation of a similar claim.]
A recent paper by Kinney et al. (Winter season mortality: will climate warming bring benefits?) suggests that reductions in cold-related mortality under warming climate may be much smaller than some have assumed. Kinney and colleagues analyzed excess winter mortality across multiple cities and over multiple years within individual cities. They found that excess winter mortality was no lower in warmer vs. colder cities, suggesting that temperature is not a key driver of winter excess mortality. In addition, variability in daily mortality within cities was not strongly influenced by winter temperature.
Andy Pitman, Director of the ARC Centre of Excellence for Climate System Science, The University of New South Wales:
[via The Guardian]
It is true that in rich countries which tend to be in the mid to higher latitudes, some warming might help reduce deaths from cold. In the lower latitude countries – the subtropics and tropics – people rarely die of cold. In contrast they die of heat and lack of clean water. So, countries responsible for global warming might gain a minor benefit from warming while those least responsible will wear the consequences.
Liz Hanna, Australian National University:
[via The Guardian]
In 2003, 70,000 people died in western Europe, and in 2010 a further 55,000 people died in Russia and eastern Europe. These figures far exceed deaths from cold snaps. The decade 2001-2010 saw a 2,300% increase in heat deaths above the previous decade. Mr. Abbott’s assertions don’t tell the whole story, as they’re based on what has happened in the past rather than what is projected to happen in future. While more people die from cold than heat in Melbourne at the moment, this will reverse as more summer days reach the high 40s.
CLAIM: “reality has stubbornly refused to conform to the Intergovernmental Panel on Climate Change’s computer modelling”
Markus Donat, Research Fellow, University of New South Wales:
This claim is wrong. For example, this study by Rahmstorf and colleagues* shows how projections from past IPCC reports (future projections starting in 1990 and 2000) very well predicted the observed temperature changes since then.
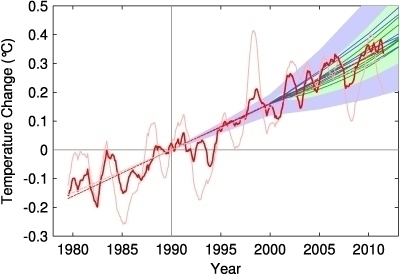
Figure – Observed annual global temperature, unadjusted (pink) and adjusted for short-term variations due to solar variability, volcanoes and ENSO (red) compared to the scenarios of the IPCC (blue range and lines from the third assessment, green from the fourth assessment report). Source: Rahmstorf et al (2012)
- Rahmstorf et al (2012) Comparing climate projections to observations up to 2011, Environmental Research Letters
CLAIM: “data suggests that the 1930s were actually the warmest decade in the United States“
This is a misleading and inaccurate “cherry pick”, as the United States has seen a clear warming trend over the last century.
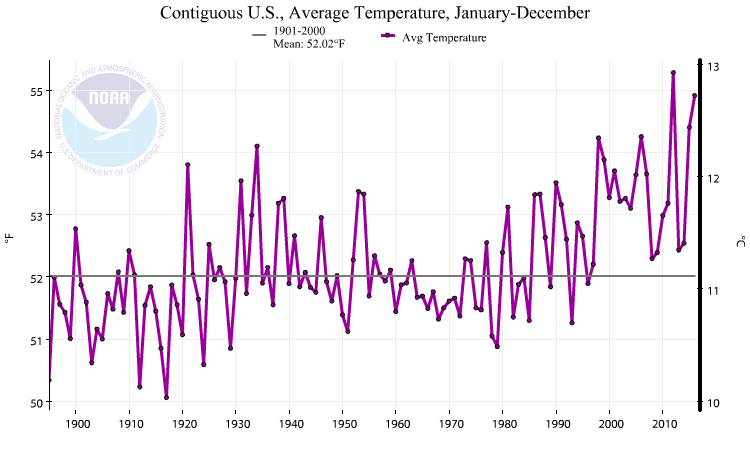
Source: NOAA
Markus Donat, Research Fellow, University of New South Wales:
It is true that the eastern part of the US is different than most of the globe with regards to temperature changes. While temperatures have been rising in most regions of the world, the eastern US is known as the so-called “warming hole” because this is one of the few regions where we do not see clear long-term warming. But using this as an argument against global warming is simply nonsense and comparable to picking one rotten cherry out of a bucket with 1,000 otherwise perfect cherries, and claiming the whole bucket of cherries is rotten.
The hot temperatures in the 1930s in the US were related to a very specific coincidence of variability patterns favouring the occurrence of hot extremes (see also this study*). But if this coincidence of variability patterns would occur today in a warmer world, the records set in the 1930s would surely be broken also in this region of the world.
- Donat et al (2016) Extraordinary heat during the 1930s US Dust Bowl and associated large-scale conditions, Climate Dynamics
CLAIM: “temperatures in Australia have only increased by 0.3 degrees over the past century, not the 1 degree usually claimed.”
Read the full Claim Review here.
Markus Donat, Research Fellow, University of New South Wales:
I don’t know what the source of these numbers is. The official data for Australia by the Bureau of Meteorology, based on high-quality observations, clearly shows that average temperatures have warmed by 0.9-1 degree since 1910.
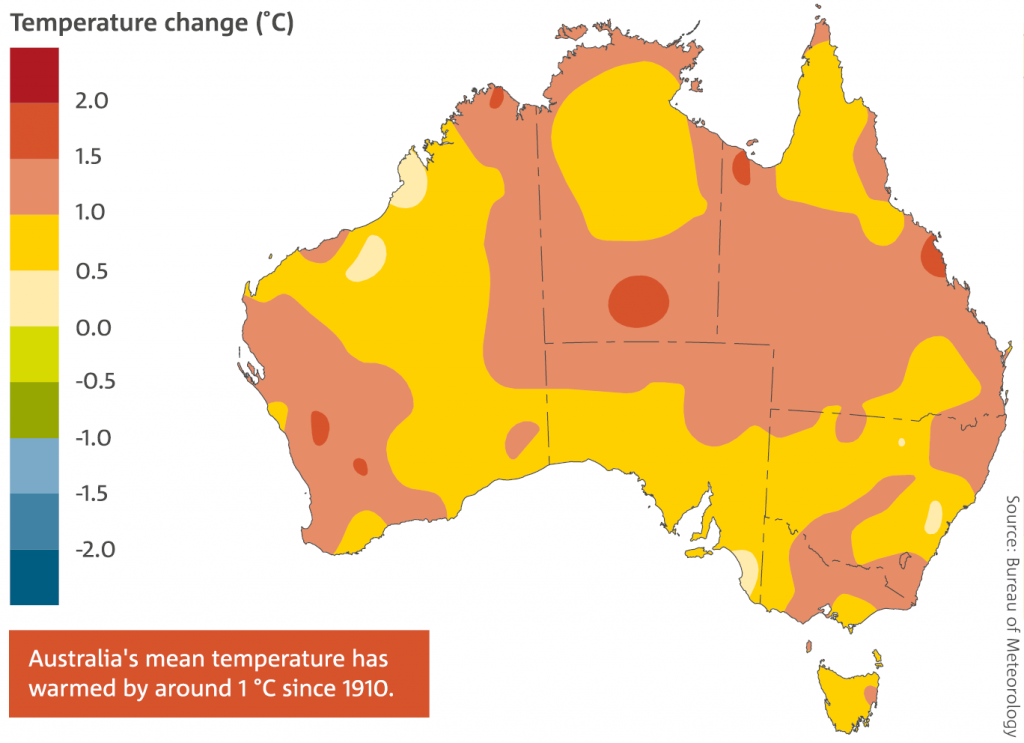
Source: BOM
Peter Thorne, Professor, Maynooth University:
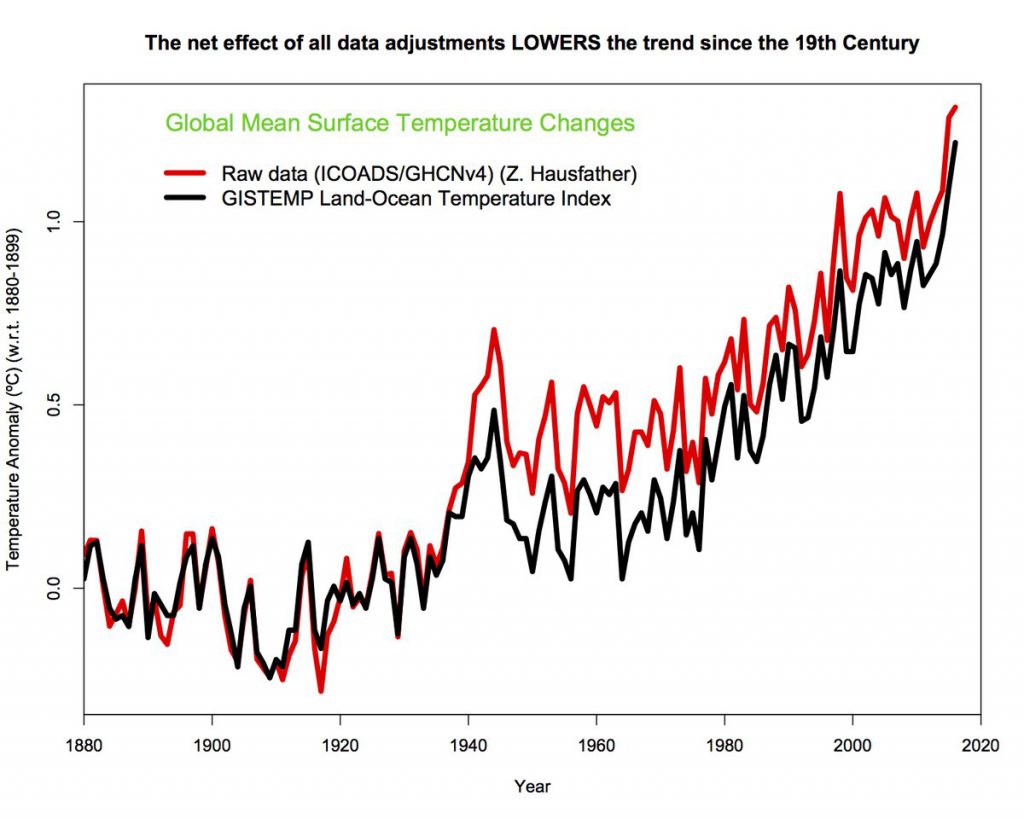
The global warming signal over the instrumental record is far larger in the unadjusted than the adjusted record. You can’t pick and choose which adjustments you happen to like. Adjustments are essential because observation techniques have changed through time and this introduces data artefacts that are not a true portrayal of the underlying climate. We have tested, replicated, and benchmarked techniques to build confidence in the techniques deployed to account for these. The choice is stark: trust the unadjusted data we know to be wrong and that shows more warming, or trust the adjusted data which has been verified scientifically many times over to improve the estimates and shows less warming.
CLAIM: “The Jurassic warm period and the ice ages occurred without any human contribution at all.”
This claim is fallacious; Abbott suggests that current climate change is natural since the climate changed naturally in the past, ignoring the fact that climate forcing can come from non-human or human origins without the two being mutually exclusive. (This is akin to saying that because people die naturally, they cannot be murdered.)
Andy Pitman, Director of the ARC Centre of Excellence for Climate System Science, The University of New South Wales:
[via DeSmogBlog]
This [claim] is misleading. The fact that climate changed in the past due to cause “A” does not mean it can only change through cause “A”. The fact is that it is changing now due to increasing CO2 on very rapid time scales. When climate changed in the past more slowly, it still caused mass extinctions. Not a happy thought!
CLAIM: “Contrary to the breathless assertions that climate change is behind every weather event, in Australia, the floods are not bigger, the bushfires are not worse, the droughts are not deeper or longer, and the cyclones are not more severe than they were in the 1800s.”
This claim is misleading, given Australia’s large natural variability in these extremes. Global trends are clearer, and many extremes are projected to increase in Australia with future warming.
Erich Fischer, Senior scientist, ETH Zurich:
[Abbott] clearly leaves out the global context. At the global scale, we have observed an increase in heatwave/warm spell intensity, frequency and duration (e.g. Perkins et al* and many other follow-ups). Likewise, more global stations (two-thirds) recorded an increase in heavy rainfall intensity rather than a decrease (one-third)—a mismatch within tens of thousands of stations that cannot be explained by chance.
Given the major variability, we would not expect to see significant regional changes in extremes everywhere over the comparatively short observational period. Cherry-picking the few areas like the US midwest where the warmest temperatures date back from the highly exceptional 1930s does not change the fact that the vast majority of the global land surface has seen a strong increase in heatwaves.
- Perkins et al (2012) Increasing frequency, intensity and duration of observed global heatwaves and warm spells, Geophysical Research Letters