

Misrepresents a Complex Reality: Because tides rise and fall along the coast, a pair of photos taken at different tide phases cannot show you whether long-term sea level rise has occurred.

REVIEW
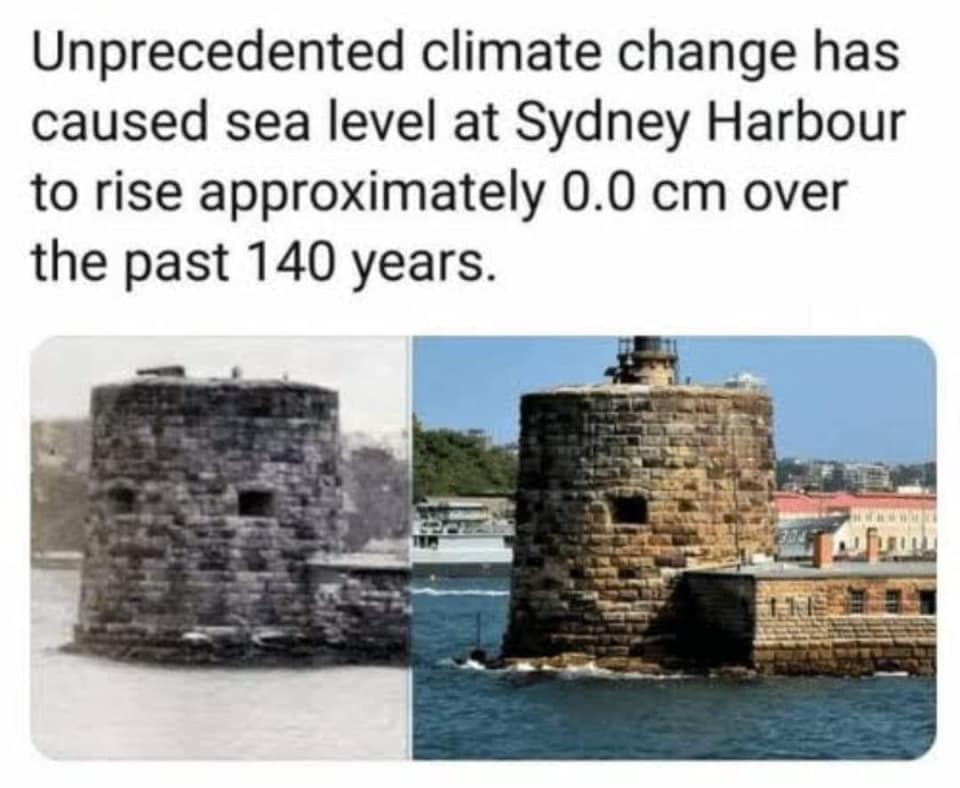
CLAIM: Unprecedented climate change has caused sea level at Sydney Harbour to rise approximately 0.0 cm over the past 140 years.
John Hunter, Research Associate, University of Tasmania:
The maximum range of the variability in water level due to tides and storm surges at “Sydney Harbour” (the location shown is actually Fort Denison) is around 2 metres (i.e. it varies around mean sea level by around +/- 1 metre).
Therefore, if you take a photograph and you don’t quote (or even know) the state of the tide or surge at that time, then all you can say is that the level shown is the mean sea level +/- 1 metre (where I’m here quoting the maximum possible, or limit, of the error; I do this in all of the following).
If you take two photographs at different times, then the visual difference between the two water levels only tells you the change in mean sea level to an accuracy of +/- 2 metres.
If we suppose that the visual sea level in the two photos is the same (I’d guess that you could only tell this to an accuracy of around 0.5 metres, but let’s ignore this additional error), then all this tells us is that that mean sea level has changed by 0 +/- 2 metres or 0 +/- 2000 mm.
If the elapsed time is 140 years (as quoted in the Facebook post), then the rate of sea level rise is constrained to 0 +/- 2000/140 mm/year (or 0 +/- 14 mm/year). This hardly tells us anything useful about mean sea-level rise.
The tide-gauge record from Fort Denison is discussed by White et al1. The paper summarises earlier estimates of relative sea-level rise (i.e., the sea-level rise relative to the land, or in other words, sea level rise as “seen” by a tide gauge) as:
“You et al. (2009) estimated rates of relative sea level rise at Fort Denison of 0.63 ± 0.14 mm/yr for 1886–2007, 0.93 ± 0.20 mm/yr for 1914–2007 and 0.58 ± 0.38 mm/yr for 1950–2007. Mitchell et al. (2000) estimated a trend of 0.86 mm/yr for 1914–1997.”
Clearly, the “result” from the two photos of Fort Denison (0 +/- 14 mm/year) provides no information which could improve or disprove the results quoted by White et al. You should note that the error estimates quoted by White et al1 (which are presumably +/- 1 standard deviation) are not exactly comparable with the error limits that I have quoted (which would be +/- several standard deviations). However, my statement still stands—the “result” from the two photos of Fort Denison provides no information which could improve or disprove the results quoted by White et al1.
Table 4 in White et al1 gives their own estimate of relative sea-level rise at Fort Denison (here called “Sydney”) as 0.8 mm/year over the period 1966 to 2010, which is broadly consistent with the earlier estimates that they quoted. This is low, but just consistent with the Australian average of 1.5 +/- 0.6 (s.d.) mm/year.
In the Discussion of White et al1, they provide the following caution:
“The detailed description of the Sydney Fort Denison tide gauge and its data (Hamon, 1987) highlights a number of uncertainties and potential problems in the earlier parts of this record. Some of these may be related to chart digitising problems and some to registration errors, both physical and in the data recording. Great care should be taken in interpreting a single long record, no matter how much care was taken with it at the time of digitisation and in post-processing. The scales of the phenomena discussed here are of the order of several hundred to thousands of kilometres ….. so we should not rely on single records for predicting long-term and large-spatial-scale phenomena.”
So—don’t take just one tide-gauge record as indicative of global sea level.
- 1- White et al (2014) Australian sea levels—Trends, regional variability and influencing factors, Earth-Science Reviews
Thomas Frederikse, Postdoctoral researcher, Jet Propulsion Laboratory/California Institute of Technology:
In the last 140 years, global mean sea level has risen by about 15 cm. Not sure about my eyes, but detecting a 15cm sea-level difference from these pictures seems difficult. What you could see on the picture is the dark brownish band that is much larger on the right picture than on the left. Assuming that this brownish band denotes the tidal range, the right picture has been taken at low tide, while the left picture has been taken at a much higher tidal level. In Sydney, the typical tidal range is about 1 meter. Therefore, if you compare two pictures to derive sea level changes, the odds are that you’re comparing tidal levels rather than long-term sea-level changes. The catch with sea level is that it’s not just the mean level that rises, but the high tide level will also rise. Therefore, without detailed information on the exact timing of the picture and a tidal chart, one simply cannot derive decimeter-accuracy estimates of sea-level change from these two pictures.
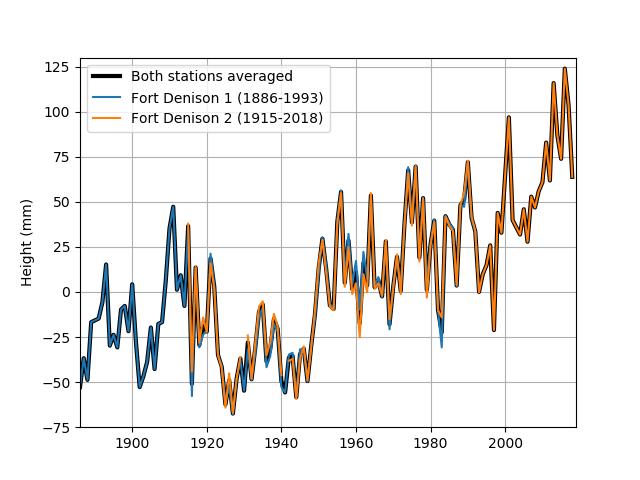
Then to sea level in Sydney. At Fort Denison, which is the building in the picture, we have two long tide gauge records. One that covered 1886-1993, and one that started in 1915 and is still measuring today. I’ve plotted both individual records and the average of them. Both the records clearly show that sea level is rising in Sydney, and that the rate of the rise is increasing. However, the 20th-century rate in Sydney is about 0.8 mm/yr, which is smaller than the global mean of ~1.4 mm/yr.
There are many processes that cause sea level to rise at different rates over the globe. For Sydney, one of the processes that cause a below-average rate of sea level is Glacial Isostatic Adjustment. During the last glacial cycle, large parts of the Earth were covered by thick ice sheets, often more than a kilometer thick. The solid Earth below these ice sheets deformed under this load. Eventually, these ice sheets have melted, but the Earth is still recovering from these loads, which still causes the Earth’s shape to change. For Sydney, this means that the Earth is lifting up by about 0.3 mm/yr1, which could explain a part of the difference.
Long story short: from these pictures, one cannot conclude that sea level in Sydney has risen by 0.0 cm. In fact, two independent tide gauge records show that sea level in Sydney has risen by about 12 cm since the end of the 19th century.
- 1- Peltier et al (2017) Comment on “An Assessment of the ICE‐6G_C (VM5a) Glacial Isostatic Adjustment Model” by Purcell et al, Journal of Geophysical Research – Solid Earth