


REVIEW
CLAIM: There is no evidence of sea-level rise in before and after photos (i.e., from the past and present) from some locations. Therefore, sea-level rise is not occurring or causing negative impacts.
Several social media posts have gone viral after sharing ‘before and after’ photos from the past and present to claim that sea-level rise has not occurred. For example, a number of these posts show photos of Sugarloaf Mountain in Brazil, labeled with the years 1880, 1910, and 2020 and captions claiming that sea level is not rising. One such post on Facebook, linked here, has been shared thousands of times. Below we will investigate these claims using scientific evidence, and explore how scientists measure sea-level rise.
Scientists determine sea-level rise by collecting and analyzing data, not by comparing a few photos
Before investigating the evidence, we will first explain why these viral posts are highly flawed in their ‘method’ of assessing sea-level rise. These posts claim that sea level has not risen based on photos taken at certain locations in different years; examples of which are shown in Figure 1.
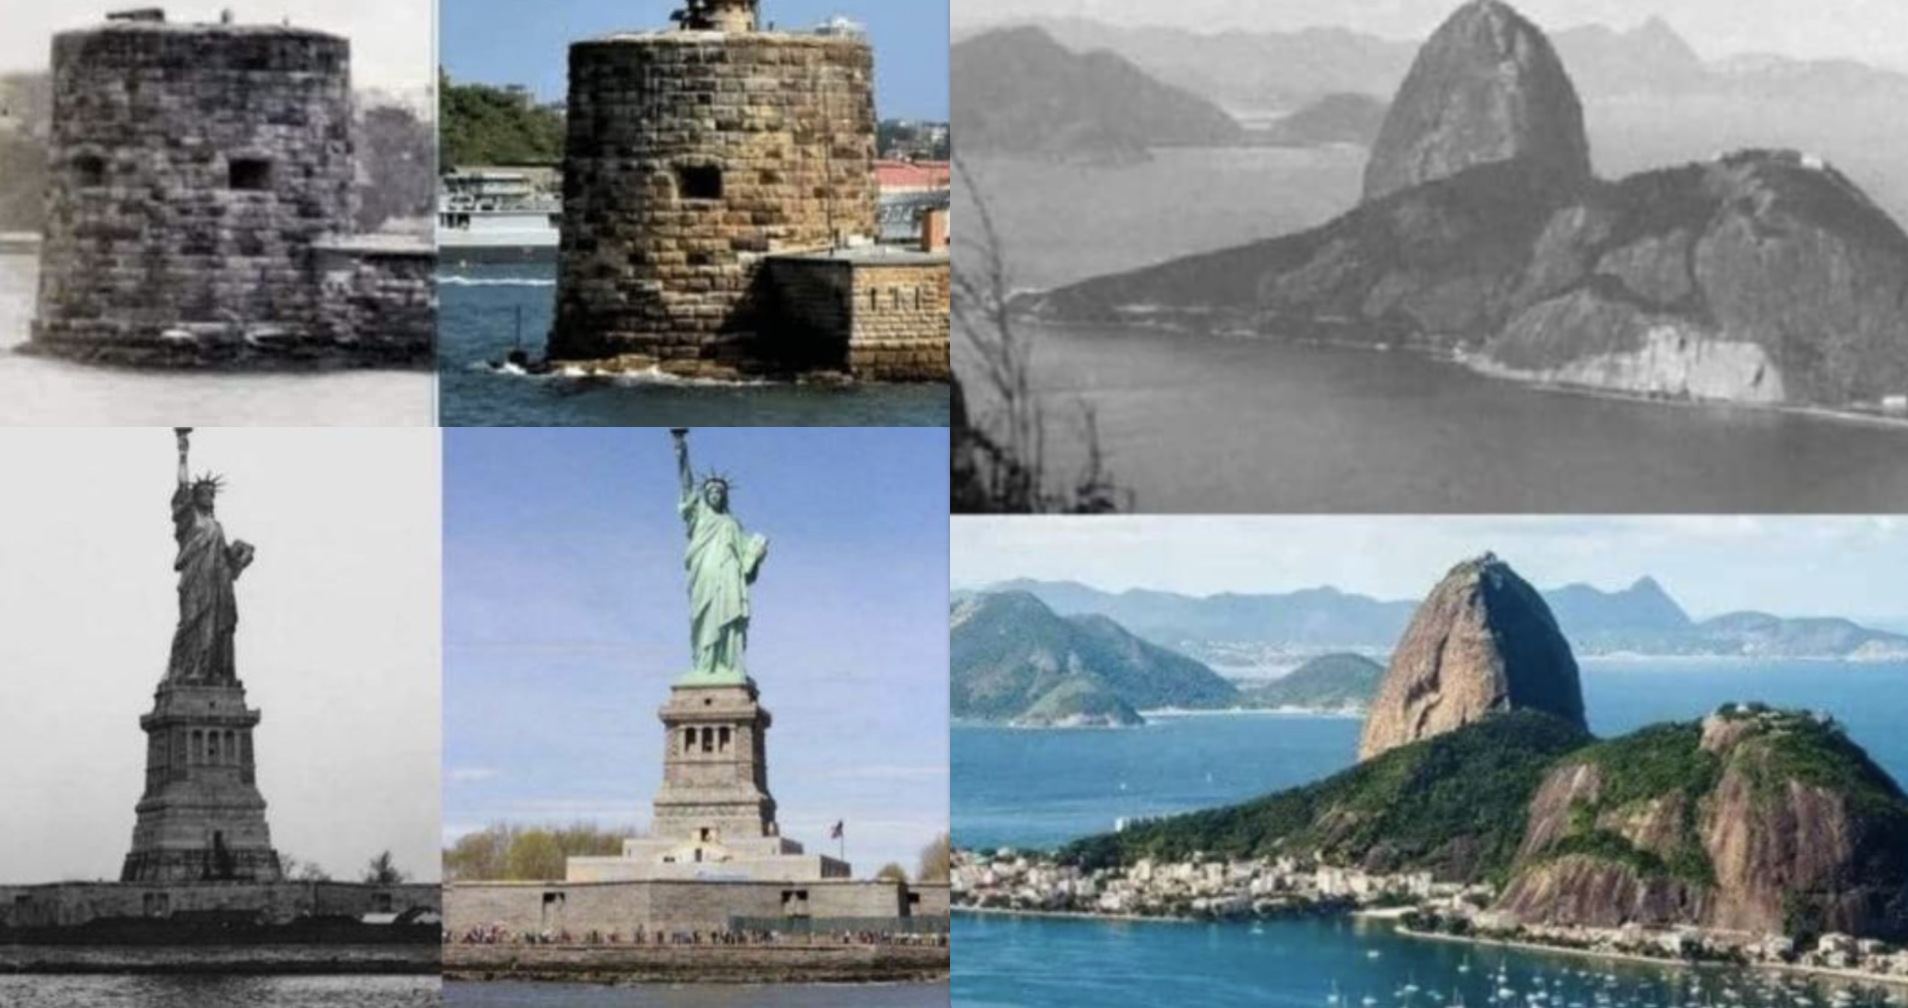
Figure 1 – Examples of locations shown in social media posts claiming that ‘sea levels have not risen’. The two top left photos are of Fort Denison in Sydney Harbour; the two bottom left photos are of the Statue of Liberty in New York City; and the two photos on the right half of the figure are of Sugarloaf Mountain in Brazil. Source: social media screen captures
However, using these photos for comparison is flawed because they are missing critical details and context. There are a number of variables that affect sea level; one of the most important in this case is tidal conditions. Even if two photos are taken at the exact same location on the same day, the sea level at that location will be different at low and high tide (i.e., at different times of the day). As explained by the National Oceanic and Atmospheric Administration (NOAA), tides are changes in sea level that are caused by the gravitational pull on our oceans by the Earth, Moon, and Sun. These forces cause the oceans to bulge outward, roughly in line with the moon, and dip inward at a right angle to this line (Figure 2).
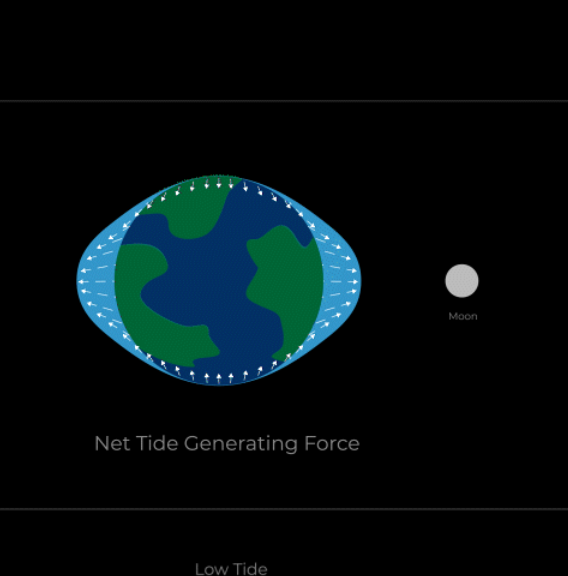
Figure 2 – Diagram showing tidal bulge as a result of net gravitational pull on Earth’s oceans. Note that these bulges are exaggerated for visualization purposes, and that as a coastline passes through a bulge, its respective landmass (e.g., continent) has a much higher elevation than the rise in sea-level – and thus does not become fully submerged by the rising oceans. But instead, it experiences a high tide. Adapted from the following source: NASA/Vi Nguyen
Because Earth rotates over a 24 hour period, sea-levels change throughout the day as both landmasses and oceans collectively move through these bulge and dip zones. This causes alternating high and low tides every 6 hours. The difference in sea level at low and high tide depends on the position of the Moon. For example, NOAA explains that “the greatest difference in height occurs around new and full moons, 6.27 ft. (1.91 m) and 7.18 ft. (2.19 m) respectively”. An example of sea-level fluctuations over days to weeks with different tides is shown in Figure 3 below. For a more in-depth explanation and visualization of how tides work, see the link here.
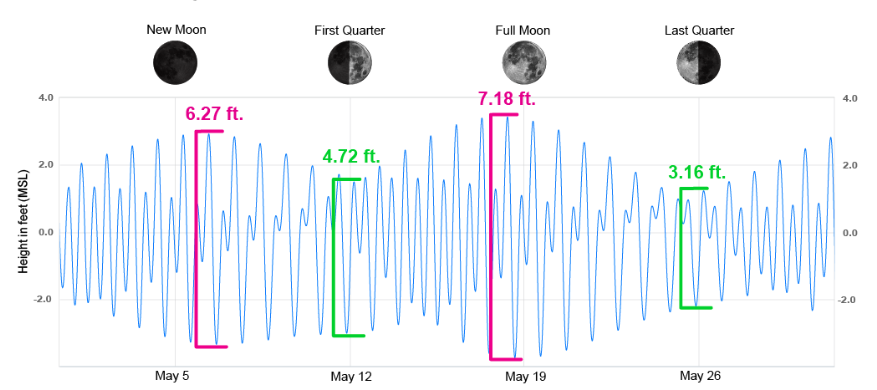
Figure 3 – Sea-level fluctuations in Santa Barbara, California, over days to weeks. Days are shown on the x-axis and average/mean sea-level height (MSL) in feet is shown on the y-axis. The moon phases are shown above the graph, with the corresponding differences in high and low tide elevations shown directly below them. Note that the largest differences occur during a new moon and a full moon. Source: NOAA
Because of the processes described above, it is flawed to compare sea level in two different photos without knowing the date and time, and thus the tidal conditions when they were taken. Hypothetically, an older photo could be taken at a high tide and a newer photo taken at a low tide, disguising the sea-level change occurring between those years. However, even with more context for the photos, there is still another major flaw with this method; they collected no actual measurements, and there is no appropriate scale in the photos. For example, in one of the claim-making posts they show photos of the ocean below a landmark called Sugarloaf Mountain, with a peak of 396 meters (1,299 feet) located in Rio de Janeiro. However, there is no scientific consensus that this landmark, or the others shown in these posts, should show visual changes due to sea level rise that occurred between the photo dates. Over the alleged time period shown in the photos of 1880-2020, global mean sea level (GMSL) has risen roughly 21–24 centimeters (8-9 inches), according to NOAA (Figure 4). However, based on Google Earth measurements, the photo was taken at a distance that shows nearly a 2 kilometer stretch of land – a scale that does not match the magnitude of sea-level rise in this period.
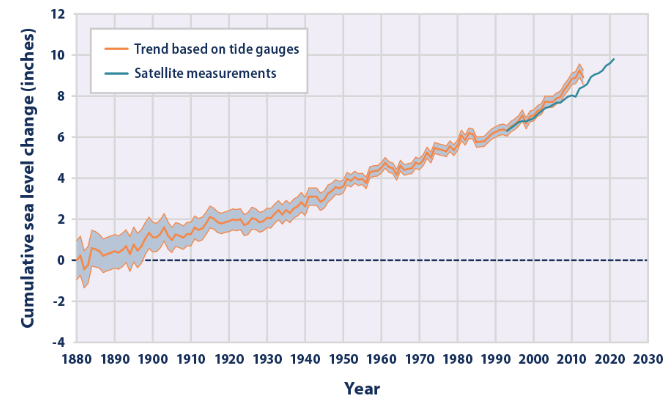
Figure 4 – Global average absolute sea-level change (in inches) from 1880-2021, based on tidal gauge measurements (orange line) and recent satellite measurements (blue line). Note that ‘absolute’ sea-level change is used to represent the ocean’s surface, without regard to changes in nearby land elevation. Figure source: United States Environmental Protection Agency (EPA) with data from NOAA and CSIRO (2017)[1]
It is also misleading to cherry pick a few locations (e.g., near Sugarloaf Mountain) to show the ‘impacts’ of sea-level rise, because sea-level rise and its effects vary by region. This is part of the reason scientists create flood vulnerability and exposure maps, like the one linked here. One reason for this variability is that steep areas are less susceptible to inundation (i.e., flooding from rising water) than low-lying areas. This occurs because water needs to rise higher to submerge high-elevation areas than does for areas of lower elevation. This is apparent on flatter beaches, for example, because at high tide the ocean moves much further inland than it does on steeper beaches.
When scientists study sea-level rise, they do not rely on ‘before and after’ photographs from one location. Instead, they collect data from around the world and use it to observe trends. In doing so, they can measure sea-level rise more accurately, and avoid the uncertainty that comes with comparing photographs without adequate information and scale. So what does the evidence show when scientists properly collect and analyze sea-level data?
Data from around the world shows that global mean sea-level has risen over the last century; some areas have risen more than others
The social media posts actually make two claims – the explicit claim that sea level is not rising and the implied claim that it is not problematic, otherwise we should see visual evidence of impacts in photos of these locations. The reason these types of posts can convince viewers is that they simplify a complex topic. The underlying assumption in these posts, for example, is that ‘if sea level has risen, these locations – and by extension, all coastal areas – on Earth should show evidence of it in before and after photographs’. However, this disregards an important scientific observation: sea level does not rise at the same rate everywhere on Earth[2] – it is uneven and varies by location, as we will explain below.
To evaluate how sea levels change over time, scientists evaluate trends in data from tide gauges and satellites. As shown in Figure 4 from the previous section, these data clearly show that global mean sea level has risen since 1880 – the earliest alleged date of the photos recently shared in these posts. If global mean sea level (i.e., overall sea level) has risen, and sea level does not rise at the same rate everywhere on Earth – what happens at a local or regional level? What changes should we see? That depends on the location.
At a local level, some places are more vulnerable to the effects of sea-level rise than others. As we briefly explained earlier, one reason for this is that the terrain (e.g., flatness or steepness) of different areas can affect how ocean water moves inland during tidal changes. For this reason, a photo taken at low tide might show land exposed that would later be submerged in a photo taken at high tide. An example of this is shown in Figure 5 below. Note the difference in land exposure between the photos, which could be misleading without context about the tidal conditions when they were captured.
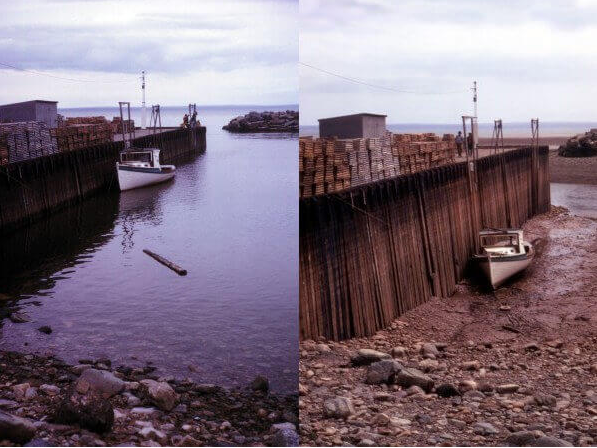
Figure 5 – Photographs taken at high tide (left) and low tide (right) at the Bay of Fundy in Canada. Note that the land exposure changes between high tide and low tide. Source: NOAA SciJinks
At a broader/regional scale, there are other physical processes that affect sea-level rise. As we mentioned, sea-level rise is not even – it does not rise in the intuitive way that water does in something like a bathtub. This is because at a planetary scale, there are many other factors at play. As explained by NASA, “The globally averaged trend toward rising sea levels masks deeper complexities. Regional effects cause sea levels to increase on some parts of the planet, decrease on others, and even to remain relatively flat in a few places.” They explain that two of the factors influencing uneven sea-level rise at a regional level are ocean dynamics (i.e., redistribution of water mass by currents, wind, etc.) and varying gravitational strength. They explain that “because the distribution of Earth’s mass is uneven, Earth’s gravity is also uneven. Therefore, the ocean’s surface isn’t actually a perfect sphere or ellipsoid; it is a bumpy surface” (Figure 6).
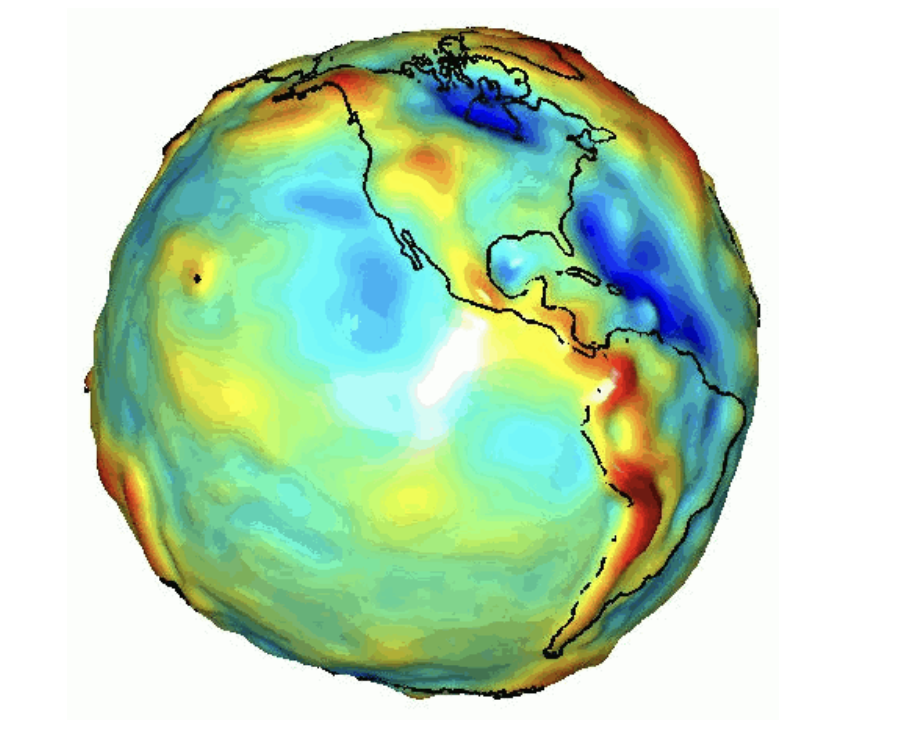
Figure 6 – Visualization of Earth’s gravitational field showing regions with red showing areas where gravity is stronger, blue where gravity is weaker, and a spectrum between. Source: NASA with data from University of Texas Center for Space Research
Despite local and regional variability, several individual locations – such as those shown in the social media post photos – do in fact show sea-level rise based on tidal gauge data. For example, one of the locations discussed earlier – Sugarloaf Mountain (Figure 1) – that was shared in the posts has nearby sea-level measurements from 1963-2016, which show that sea level rose 12.6 centimeters (4.5 inches) in that period.
Another location shown in these posts is Sydney Harbour (Figure 1). Science Feedback has already addressed claims regarding sea-level rise at this location in a previous review, linked here. The results of that review are well-summarized in a quote provided to Science Feedback by Dr. Thomas Frederikse, Postdoctoral researcher at the Jet Propulsion Laboratory/California Institute of Technology:
“At Fort Denison, which is the building in the picture [Figure 1], we have two long tide gauge records. One that covered 1886-1993, and one that started in 1915 and is still measuring today. I’ve plotted both individual records and the average of them. Both the records clearly show that sea level is rising in Sydney, and that the rate of the rise is increasing.”
A third location from these social media posts is the Statue of Liberty in New York City (Figure 1). As with the other examples, this location also shows a clear rise in sea level; from 1856-2023 the sea level in this area rose by roughly 49.1 centimeters (19.33 inches) (Figure 7).
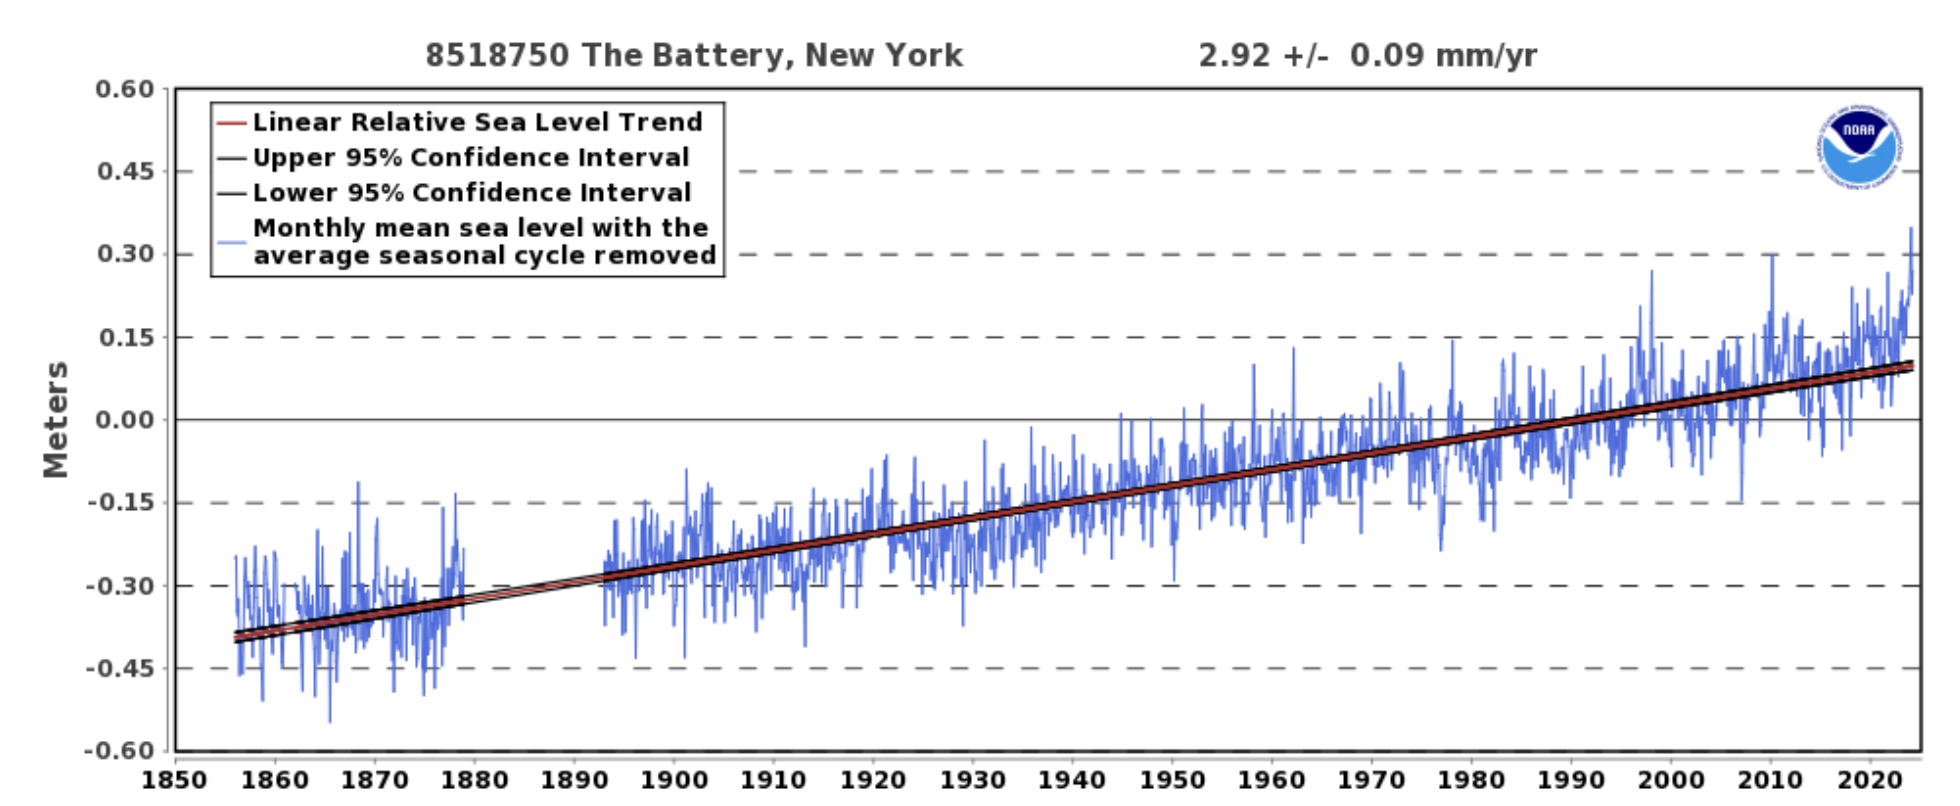
Figure 7 – Relative sea level trend based on data from 1856-2023 at The Battery in New York (close to the Statue of Liberty). Source: NOAA
In summary, all three locations above – which are commonly used in social media posts to claim sea levels have not risen – show clear evidence of sea-level rise. In addition, previous Science Feedback reviews have also found evidence that global mean sea level rise is speeding up. As explained in a review from 2021 linked here: while land mass movements and ocean circulation patterns influence sea levels, human-induced climate change is accelerating the rate of sea level rise[3]. This point is also summarized in a 2018 paper by Horton et al.: “a large portion of the twentieth-century rise, including most GMSL rise over the past quarter of the twentieth century, is tied to anthropogenic warming”[4]. The Intergovernmental Panel on Climate Change (IPCC) – the world’s leading authority on climate science – explains that “as a consequence of natural and anthropogenic changes in the climate system, sea level changes are occurring on temporal and spatial scales that threaten coastal communities, cities, and low-lying islands”[5].They also explain that “coastal ecosystems are already impacted by the combination of SLR [sea-level rise], other climate-related ocean changes, and adverse effects from human activities on ocean and land”[5].
Conclusion
Scientists have shown that global mean sea level has risen since the year 1880 by analyzing data from tidal gauges and satellites. Relative sea level rise – that which is measured at a local or regional scale – can vary due to Earth’s shape and ocean dynamics. However, contrary to claims from social media users, even the locations from photos on their posts show rising sea levels based on tidal gauge measurements. Social media posts comparing ‘before and after’ photos of cherry-picked locations to ‘assess’ sea-level rise are flawed because they are missing important details about tidal conditions, scale, and context about how sea levels are measured and vary across Earth. Additionally, implying that there are no impacts is inaccurate because evidence shows that rising sea levels have already caused negative impacts (e.g., to coastal ecosystems).
REFERENCES
- 1 – Church et al. (2011) Sea-level rise from the late 19th to the early 21st Century. Surveys in Geophysics.
- 2 – Rovere et al. (2016) Eustatic and Relative Sea Level Changes. Current Climate Change Reports.
- 3 – Slangen et al. (2016) Anthropogenic forcing dominates global mean sea-level rise since 1970. Nature Climate Change.
- 4 – Horton et al. (2018) Mapping Sea-Level Change in Time, Space, and Probability. Annual Review of Environment and Resources.
- 5 – IPCC (2019) Special Report on the Ocean and Cryosphere in a Changing Climate.