


REVIEW
CLAIM: Historical data destroys the global warming myth, and people are waking to it. According to NOAA’s own historical data, of the 50 U.S. state all-time record high temperatures, 23 were set during the 1930s, while 36 occurred prior to 1960 — climate change proponents are feeding us a fairy tale, and I’m sick of it.
SUMMARY
The claim that historical temperature data in the U.S. “destroy the global warming myth” appeared in an article published by Electroverse in January 2020, receiving almost 1,500 shares on Facebook since then. By focusing solely on maximum daily temperature records in one small region of the world, the claim uses flawed reasoning to argue that global warming is a myth. Even if the U.S. showed steady or cooling temperature trends, this would not prove that global warming isn’t happening given warming elsewhere.
Scientific studies have demonstrated consistent warming trends around the world (see the figures below)[1,2]. As described in Neukom et al. (2019), “the warmest period of the past two millennia occurred during the twentieth century for more than 98 percent of the globe.”[3]
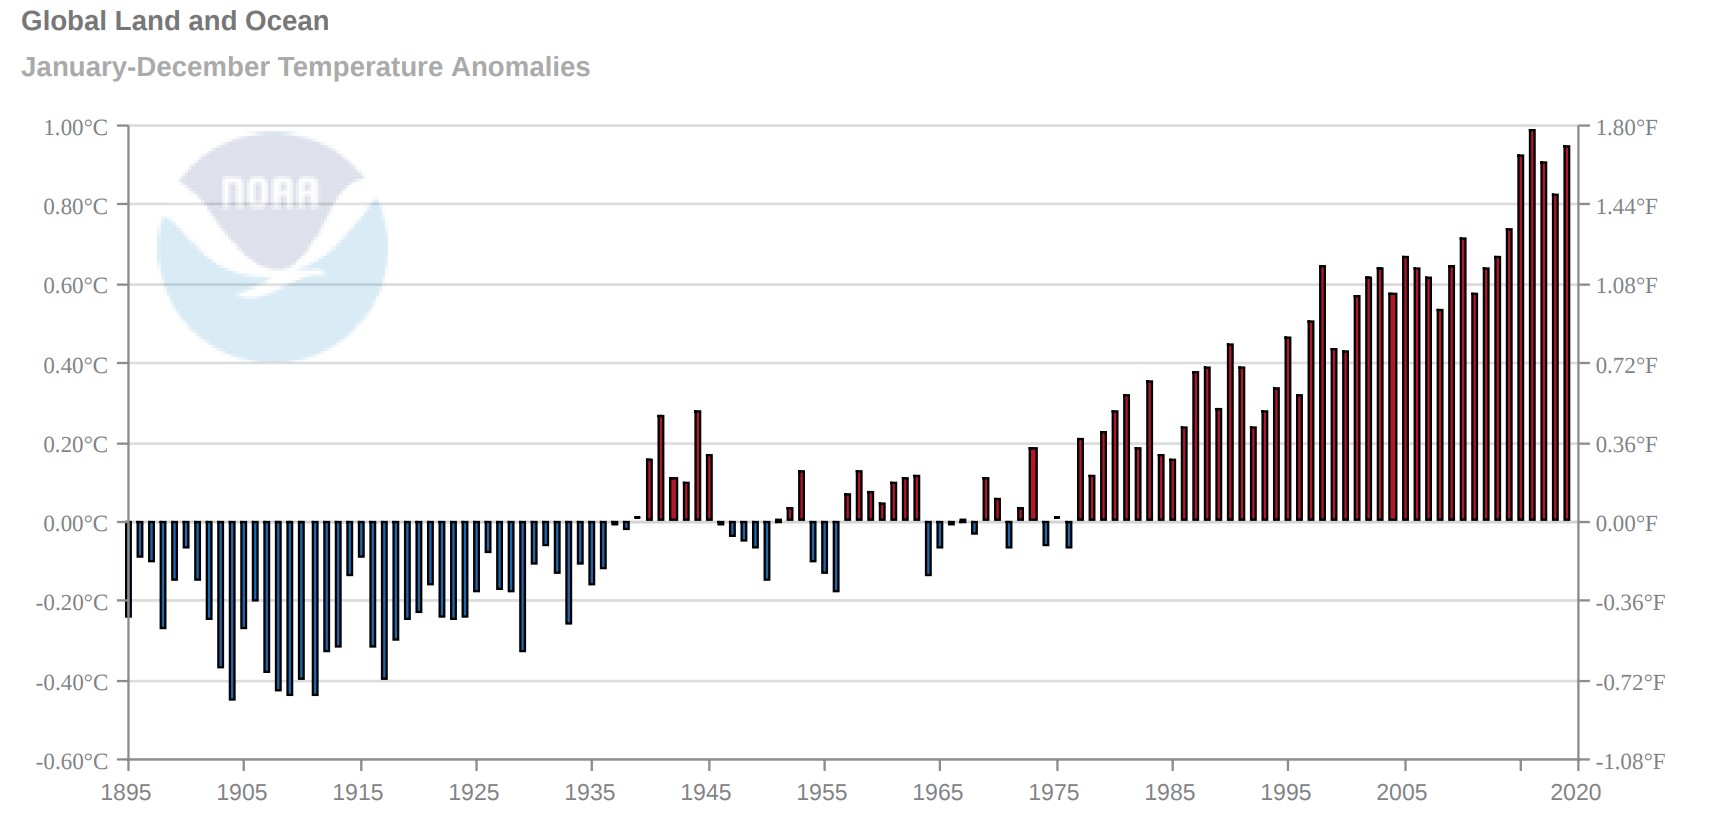
Figure—Global temperature anomaly data relative to the 20th century average temperature from the Global Historical Climatology Network-Monthly data set and International Comprehensive Ocean-Atmosphere Data Set. These data sets show consistent global warming trends. From NOAA.
Historical data from NOAA clearly shows a warming trend in the U.S. as well from January 1895 to December 2019 (see the figure below).

Figure—Monitoring networks of temperature anomalies relative to baseline temperatures in the contiguous U.S. (USCRN, ClimDiv, USHCN) from January 1895 to December 2019 show consistent warming trends. From NOAA.
The global warming trends in the U.S. are “noisier” than the global data set, primarily because the U.S. only occupies ~2 percent of the world and regional, natural oscillations in temperature are more apparent. Although the specific claim that “of the 50 U.S. state all-time record high temperatures, 23 were set during the 1930s, while 36 occurred prior to 1960” is consistent with NOAA data, this data does not follow maximum temperature trends observed in other regions around the world. King (2017) describes, “Many heat records in the central U.S. still date from the 1930s Dust Bowl period when unusual atmospheric flow and very dry spring periods allowed severe heat extremes to develop (Donat et al., 2016), but in most other parts of the world, current temperature records date from the last few decades.”[4,5]
Furthermore, local daily temperature records are not suitable measurements for assessing global warming trends. This claim relies on maximum temperature records collected at a single station in each state. Temperature data from a single station can be influenced by several factors, including time of day the measurement was taken, the angle of the sun, and instrument variation, as Victor Venema explains in the comments below. Lastly, maximum temperature records do not necessarily reflect the warmest years on record nor the average number of warmest days for each state. For example, although the 1930s were relatively warmer than the 1920s and 1960s, it was not warmer than the past two decades.
In conclusion, the fact that some local daily heat records were set in the 1930s can not be used as evidence that a warming trend is not happening at the global scale.
SCIENTISTS’ FEEDBACK
Victor Venema, Scientist, University of Bonn, Germany:
The post does not support the erroneous claim that historical data destroys the global warming myth. It did not even look at global warming, in other words it did not look whether the global mean temperature shows a long-term increase.
The post looked at station data in America, which only covers about 2% of the Earth. Global warming is about the globe. America is known for the Dust Bowl in the 1930, which produced many heat records. While we also expect heat waves to increase, the relationship between the average temperature and record temperatures is complicated, if records would not increase that would not invalidate the increase in the mean. That would require study of the mean temperature.
The post did not look at the mean temperature, but at the maximum temperature. Also the minimum temperature shows many record cold temperatures in the first half of the period, which the post conveniently did not mention. Records are rare and hard to measure. For that reason alone they are more spread out over the measurement period and show a less clear trend than the mean temperature.
The post looked at raw data, which is not well suited to study warming. For example modern automatic weather stations measure a somewhat smaller temperature than traditional Cotton Region Shelters. You can see this by making side by side measurements with both instruments. In as far as this difference is due to the sun influencing the temperature observations it will be larger for summer temperatures, for the maximum temperature and especially for heat waves and droughts. Global warming is about actual warming, not about changes in the instrumentation.
It is just a post on the internet, not a scientific study. In a scientific study the authors would have had to describe exactly what they did. It is not even clear what a record in a certain US state means in this post. Is this one station in a state having a record or the average temperature over the state having a record?
For all of the above reasons the claim about global warming does not fit to the presented evidence and would never hold up in the scientific literature, which the authors bypass to directly deceive their readers most of whom will not be aware of the above problems.
Stephen Po-Chedley, Research Scientist, Lawrence Livermore National Laboratory:
[Comment from a previous evaluation of a similar claim.]
Global temperature datasets, developed by a number of independent research groups, show robust warming in the troposphere and at the Earth’s surface. The radiative effect of carbon dioxide has also been observed[6]. Considering multiple lines of evidence, the IPCC concluded that it is “extremely likely that human influence has been the dominant cause of the observed warming since the mid-20th century.” More recent analysis of satellite data shows that tropospheric warming from the satellite record is pronounced and cannot be explained by natural climate variability alone[1].
Mark Richardson, Research Associate, Colorado State University/NASA JPL:
[Comment from a previous evaluation of a similar claim.]
World temperatures measurements began in the 1800s and show a warming burst since the 1970s. Last year we checked with satellite scans of the ocean, confirming the accuracy of the surface measurements[2]. Global warming is a measured fact.
REFERENCES
- 1- Santer et al (2017) Tropospheric warming over the past two decades. Scientific Reports.
- 2- Hausfather et al. (2017) Assessing recent warming using instrumentally homogeneous sea surface temperature records. Science Advances.
- 3- Neukom et al. (2019) No evidence for globally coherent warm and cold periods over the preindustrial Common Era. Nature.
- 4- King (2017). Attributing Changing Rates of Temperature Record Breaking to Anthropogenic Influences. Earth’s Future.
- 5- Donat et al. (2016). Extraordinary heat during the 1930s US Dust Bowl and associated large-scale conditions. Climate Dynamics.
- 6- Feldman et al (2015) Observational determination of surface radiative forcing by CO2 from 2000 to 2010. Nature.