
On March 29th, the US House Committee on Science, Space, and Technology held a hearing on the topic of climate science and the scientific method. Only four witnesses were invited to testify before the committee, which cannot be representative of all the expertise required to understand a field as vast as climate science. So we have asked for additional scientists to weigh in on some noteworthy, scientifically verifiable statements made during the hearing to provide a broader and more representative view of the state of scientific knowledge.
A selection of the scientists’ comments is provided below.
SCIENTISTS’ FEEDBACK
“It is an empirical fact that the Earth’s climate has warmed overall for at least the past century. However, we do not know how much humans have contributed to this warming and there is disagreement among scientists as to whether human-caused emissions of greenhouse gases is the dominant cause of recent warming, relative to natural causes” – Judith Curry
James Renwick, Professor, Victoria University of Wellington:
Most of this paragraph is misleading. There are very reliable numerical estimates of the human contribution to warming, as detailed in the last IPCC report. The headline statement from IPCC AR5 was “It is extremely likely that human influence has been the dominant cause of the observed warming since the mid-20th century.”
Gavin Schmidt, Director, NASA Goddard Institute for Space Studies:
There is indeed overwhelming evidence for warming in the last century. Curry’s claim that no one knows the attribution of this to human impacts is not a valid description of the state of knowledge. There are indeed plenty of studies that use statistical or model-based fingerprints to assess this and they overwhelmingly find a dominance of human activities over natural forcings or internal variability. For the more recent period (1950 onwards) the claims are even stronger—that effectively all the warming is caused by human activity with only a ~10% uncertainty due to internal variability. One can always find something to disagree with in such a statement, but disagreement in the absence of any quantitative result to the contrary is not worth much. Curiously, the paper* that Curry cites to claim a low sensitivity assumes that all the warming is human caused. [See this post for more.]
- Lewis and Curry (2015) The implications for climate sensitivity of AR5 forcing and heat uptake estimates, Climate Dynamics
Timothy Osborn, Professor, University of East Anglia, and Director of Research, Climatic Research Unit:
This is incorrect: assessments of the cause of recent warming consistently find that greenhouse gases are the dominant cause of recent warming. These assessments consider other climate forcings, including natural effects (the most important ones on timescales of decades are variations in solar and volcanic activity) and human-caused aerosols, but the most likely effect of these other forcing would have been to cause global cooling in recent decades. Thus, there is agreement between scientists that the observed warming is due to human-caused emissions of greenhouse gases.
“And even the IPCC says more than half. That’s from 51 percent to 99 percent. That is a big interval… I just don’t know how much is human vs. how much is natural and I think there is a great deal of uncertainty and it is very difficult to untangle it” -Judith Curry
Timothy Osborn, Professor, University of East Anglia, and Director of Research, Climatic Research Unit:
Judith Curry’s interpretation of the IPCC’s assessment as meaning a range from 51 to 99 percent is incorrect. First, the range extends beyond 99 percent, because natural influences may have offset some of the warming from human activity. Second, because it suggests a uniform likelihood within that interval whereas the likelihood is low that the real contribution is near the edges of the range (i.e., as low as 51 percent of the observed warming or as much as one and a half times the observed warming).
There is indeed a great deal of uncertainty, but the IPCC assessed range takes this into account—by quantifying those uncertainties that can be quantified, and by making a broader, more conservative range to account for those that can’t be quantified.

“Current global climate models are not fit for the purpose of attributing the causes of recent warming or for predicting global or regional climate change on timescales of decades to centuries, with any high level of confidence.” -Judith Curry
Reto Knutti, Professor, ETH Zürich:
This statement is at odds with just about every detection and attribution study, every climate model, and basic physical principles of the global energy budget. The trend in natural forcing (solar and volcanic) from about 1950-2000 is nearly zero and can therefore not explain the observed warming. Natural variability is much smaller than the observed warming. In a recent study* we showed that “even if models were found to underestimate internal variability by a factor of three, it is extremely unlikely that internal variability could produce a trend as large as observed.” This leaves anthropogenic forcings as the main drivers, and we understand why: it is the physics of the greenhouse effect, which have been known for more than a century.
In terms of projections, confidence is high for large scale temperature trends, ocean acidification, or sea level rise over multiple decades, but of course lower for other local impact-relevant quantities. But the fact is that even projections made decades ago with much simpler models were remarkably accurate*.
As Kevin Trenberth and I argued in a recent post, an important question to me is whether as a society we are better off with imperfect predictions than with no predictions at all. If we absolutely want to go down a potentially likely path, it would be smarter to have an imperfect map than no map at all.
- Huber and Knutti (2012) Anthropogenic and natural warming inferred from changes in Earth’s energy balance, Nature Geoscience
- Stouffer and Manabe (2017) Assessing temperature pattern projections made in 1989, Nature Climate Change
- Fischer and Knutti (2016) Observed heavy precipitation increase confirms theory and early models, Nature Climate Change
- Allen et al (2013) Test of a decadal climate forecast, Nature Geoscience
Victor Venema, Scientist, University of Bonn, Germany:“[…] I demonstrate that the consensus of the models fails the test to match the real-world observations by a significant margin.” -John Christy
John Christy has shown this plot for many years on his blog and in congressional hearings. If it were a robust result, it would be scientifically interesting, however in all these years Christy has not published a scientific article on his claims, and colleagues have had to reverse-engineer how it was made.
One thing that is clear is that due the 5-year averages the strong warming in the last 3 years is strongly suppressed in this plot. Due to the averaging of the balloon datasets and the satellite datasets, the large uncertainty in the observations is no longer visible. It is not good practice to align measurements and models by selecting only one year that happened to have been warm; to reduce the influence of such an arbitrary choice scientists normally use a longer period to align different datasets. Several of these problems have been discussed at RealClimate, but unfortunately Christy has not updated his graph.
Climate models inform us about long-term warming and have not been developed for short-term predictions, which are strongly influenced by fluctuations from, for example, El Niño. The timing of El Nino is not predictable more than a year in advance. This problem is even more the case for the upper air temperatures shown here by John Christy than for the surface temperature. The uncertainty of climate models results for short-term prediction is expected to be about twice the model spread of the CMIP models.
Gavin Schmidt, Director, NASA Goddard Institute for Space Studies:
As I’ve discussed on RealClimate, Christy makes a number of minor and one major choice in his graph that all combine to exaggerate the discrepancy between models and observations of the mid-troposphere changes. The major issue is that he does not show the structural errors in the observations, nor does he compare to the spread in the model output. Better graphs that do not make those partial choices are available:
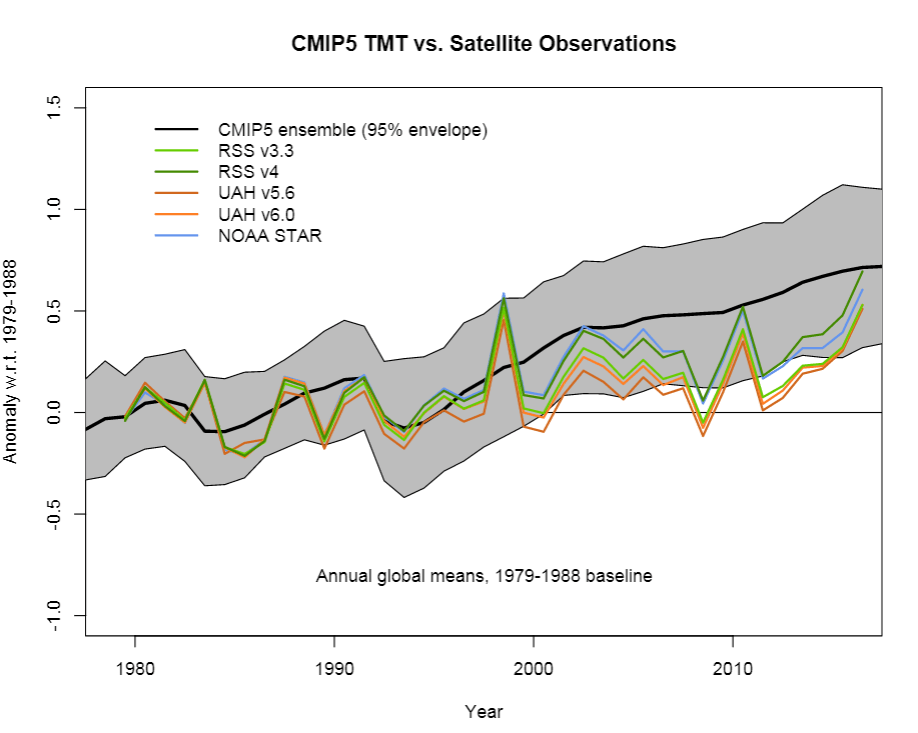
This is not to say that there are no discrepancies—there are, just not as dramatic as Christy claims. The bulk of the trends in the models for this metric are above what is reported, but with any discrepancy, there are multiple potential causes which all need to be looked at. 1) the observations may be wrong, 2) the models may be wrong, 3) the experiments may not have been realistic, or 4) the comparison is flawed. While #4 has historically been the case for many satellite-model comparisons in the past, it is no longer much of a problem. However, #1 remains a distinct possibility—and ongoing revisions to these datasets often give rise to systematic shifts in the trends. #2 is also possible—though assuming the only issue must relate to climate sensitivity is naive. But #3 is a known problem—the CMIP5 simulations did not have sufficient volcanoes, and did not predict the decrease in solar activity over the last decade or so (Schmidt et al, 2014*). Ignoring #1 and #3 in favor only of a claim about #2 is not good science. Note too that on other metrics the models are ok, or don’t shift as quickly as observed (sea ice, Hadley cell expansion, etc.)—only discussing issues where the bias is one specific way, is again a very partial approach.
- Schmidt et al (2014) Reconciling warming trends, Nature Geoscience
“Indeed, I am a co-author of a report in which we used a statistical model to reproduce, to a large degree, the atmospheric temperature trends without the need for extra greenhouse gases. In other words, it seems that Mother Nature can cause such temperature trends on her own, which should be of no surprise.” -John Christy
Timothy Osborn, Professor, University of East Anglia, and Director of Research, Climatic Research Unit:
The statistical models used in this report co-authored by Christy are flawed and thus do not support his statement that Mother Nature can cause the observed warming trends on her own. They suggest that these trends arise from cumulative anomalies of ENSO or cumulative anomalies of solar irradiance, but offer no compelling physical basis for this hypothesis. There is no consideration that a warmer climate would cause increased loss of radiative energy to space, nor that a cooler climate would decrease the emissions of radiation to space. This effect is necessary to explain how the Earth’s climate has remained within a relatively small range of mean temperatures for much of the Earth’s geological history, yet their hypothesis assumes that a step up in temperature (due, e.g. to an El Niño event) would be sustained even after the El Niño had dissipated, because they use the cumulative ENSO index. Furthermore, a cumulative variable must have a physically-defined baseline from which the anomalies are defined, which has not been done in this case. Otherwise, the baseline can be changed to produce an entirely arbitrary upward or downward trend in the cumulative variable, and thus support a false claim that the cumulative variable can “cause” a trend in the climate.
“the models tend to be too sensitive to greenhouse gases, likely related to the fact the models tend to shrink clouds more than in reality, so that more sunlight gets in and heats up the Earth more. […] The Earth has a way to release the heat that greenhouse gases try to build up.” -John Christy
Victor Venema, Scientist, University of Bonn, Germany:
John Christy provides no evidence that the discrepancy is due to the models and not due to errors in his dataset; see below. Or due to errors in the comparison.
Even if the reason were the climate models themselves, his claim that models are thus too sensitive to greenhouse gases is a second step into evidence-less territory. Without giving any evidence for it, Christy seems to assume that the reason cannot be any other factor such as the historical increases in small airborne particles (aerosols) or historical land-use changes or how much the ocean delays warming.
James Renwick, Professor, Victoria University of Wellington:
Misleading. There is a range of sensitivity to greenhouse gases [among models], some probably too insensitive and some likely overly sensitive. The distribution of model sensitivities lines up well with our understanding based on the paleoclimate record and other estimates.
Mark Zelinka, Research Scientist, Lawrence Livermore National Laboratory:
Actually there are many plausible reasons why the models tend to simulate more warming during this period, and one cannot point unambiguously toward this one explanation (model climate sensitivity errors). Among the plausible reasons are (1) their temperature fluctuations due to internally-generated variability are not synchronized with those in nature because they are freely evolving coupled simulations (e.g., El Nino events will not occur at the same time in these simulations as they did in reality, nor are the phases of decadal modes of variability in models required to track those in nature), and (2) that the external radiative forcing applied to models was systematically overestimated, which has been demonstrated to be partly caused by the neglect of cooling induced by increased stratospheric sulfate aerosols from a series of moderate volcanic eruptions post-2000 (Santer et al 2014*), as well as errors in the treatment of recent changes in solar irradiance (Kopp and Lean 2011*), stratospheric water vapor (Solomon et al. 2010*) , stratospheric ozone (Eyring et al. 2013*), and anthropogenic aerosols (Shindell et al. 2013*).
In fact, recent studies (Santer et al 2014*, Huber and Knutti 2014*) suggest that the model-observation discrepancy is very unlikely to be caused by model sensitivity errors, in contrast to Dr. Christy’s claim. For example, Huber and Knutti (2014)* note “…recent claims of much lower climate sensitivities and future warming seem much less plausible. We show that the reduced warming and mismatch between models and observations since about 1997 or 1998 can, to a large extent, be explained by the combined effect of reduced forcing and natural variability, each of these components contributing about an equal amount.”
- Santer et al (2014) Volcanic contribution to decadal changes in tropospheric temperature, Nature Geoscience
- Kopp and Lean (2011) A new, lower value of total solar irradiance: Evidence and climate significance, Geophysical Research Letters
- Solomon et al (2010) Contributions of Stratospheric Water Vapor to Decadal Changes in the Rate of Global Warming, Science
- Eyring et al (2013) Long-term ozone changes and associated climate impacts in CMIP5 simulations, Journal of Geophysical Research: Atmospheres
- Shindell et al (2013) Radiative forcing in the ACCMIP historical and future climate simulations, Atmospheric Chemistry and Physics
- Huber and Knutti (2014) Natural variability, radiative forcing and climate response in the recent hiatus reconciled, Nature Geoscience
A growing body of evidence* indicates the exact opposite [of Dr. Christy’s claim]—that low-level cloud coverage (which largely determines this planetary heating effect) tends to decrease with warming in observations, and that the models that agree best with observations are those who predict stronger-than-average decreases in low-level cloud cover with future warming. Though far from being settled, the growing evidence lines up against Dr. Christy’s claims.
- Sherwood et al (2014) Spread in model climate sensitivity traced to atmospheric convective mixing, Nature
- Qu et al (2015) Positive tropical marine low-cloud cover feedback inferred from cloud-controlling factors, Geophysical Research Letters
- Zhai et al (2015) Long-term cloud change imprinted in seasonal cloud variation: More evidence of high climate sensitivity, Geophysical Research Letters
- Brient and Schneider (2016) Constraints on Climate Sensitivity from Space-Based Measurements of Low-Cloud Reflection, Journal of Climate
- Myers and Norris (2016) Reducing the uncertainty in subtropical cloud feedback, Geophysical Research Letters
- McCoy et al (2017) The change in low cloud cover in a warmed climate inferred from AIRS, MODIS and ECMWF-Interim reanalysis, Journal of Climate
Mark Zelinka, Research Scientist, Lawrence Livermore National Laboratory:“Climate models have a large amplifying effect from clouds and water vapor. The magnitude of this amplifying effect, and even the sign, are in dispute. A lot about the oceans that we don’t understand, how the ocean transports heat and carbon in the vertical is not well represented in the climate models. We also have these very large-scale, long-term ocean oscillations, which play a huge role in determining our climate. These are not well simulated and we don’t have good documentation of the really long time period oscillations. The effects of the Sun on climate, particularly the indirect solar effects.” -Judith Curry
All models have a large amplifying effect from water vapor, which is a well-understood consequence of a warmer atmosphere maintaining nearly constant relative humidity. This is supported by basic physics and there is no credible evidence that relative humidity changes appreciably with warming, so we are confident that this amplifying water vapor feedback is realistic. The sign of this effect is not in dispute, in contrast to what Dr. Curry claims.
Dr. Curry is correct that climate models disagree on the sign and magnitude of cloud feedback, though most models simulate a positive, (amplifying) cloud feedback. Most of the inter-model spread in warming in response to CO2 comes from inter-model differences in how clouds respond. As noted in my comment to Dr. Christy’s statement below, there is growing evidence that the cloud feedback from low-level clouds (which drives much of the uncertainty) is positive in nature, but the science remains unsettled here. Certain important positive cloud feedback mechanisms are well understood and robustly simulated by models, like the positive feedback from the rise of high anvil clouds (Hartmann and Larson 2002*, Zelinka and Hartmann 2010*), whereas others are more uncertain and lack elegant physical explanations. The vast majority of studies that have compared models and observations find that models with larger-than-average cloud feedbacks are more realistic.
- Hartmann and Larson (2002) An important constraint on tropical cloud – climate feedback, Geophysical Research Letters
- Zelinka and Hartmann (2010) Why is longwave cloud feedback positive?, Journal of Geophysical Research: Atmospheres
James Renwick, Professor, Victoria University of Wellington:
The large amplifying effect of water vapor is real and is well simulated by climate models. The overall effect of changing cloudiness on the radiation budget is indeed uncertain, but models capture well the overall pattern of cloud amount globally. The effects of solar variations on global climate are well simulated by climate models. Natural variations in climate are captured with varying degrees of fidelity, but none of these lead to long-term trends in climate. It is only an external change, such as increased greenhouse gas concentrations, that lead to overall warming. Such effects are very well simulated by models.
“But while I was here in Antarctica, I met with a number of National Science Foundations that all contended that there was some degree of global warming but they added that if there was a slight or modest global warming that the sea levels would fall not rise.” -Rep. Mo Brooks (R-AL)
Matt King, Professor, University of Tasmania:
This is incorrect. Warming has been occurring through the 20th century and glaciers around the world, plus Greenland, have been melting. Further melting in the future will see a substantial further reduction in glacier and ice sheet mass, most of which will end up in the ocean and produce sea level rise.
Andrea Dutton, Visiting Associate Professor, University of Wisconsin:
This summary is not correct. The data clearly show that even with the amount of global warming that we have already experienced, that the global mean sea level has risen. The amount of snowfall over Antarctica is not enough to balance this effect of the seas rising, which itself is a function of seawater expanding as it heats up as well as the addition of meltwater from mountain glaciers and polar ice sheets (IPCC, AR5).
“We have widespread measurements now from satellites, direct measurements of the total ice mass contained in the ice sheet, and there is no question that the 2 main potential contributors to global sea level rise, the Greenland ice sheet and the west Antarctic Ice sheet are losing ice. And we know that that loss of ice means that the ice sheet are contributing to sea level rise already. Now we hear so much about uncertainty as if uncertainty is a reason for inaction but in this case the uncertainties are breaking against us because we are actually seeing more rapid loss of ice from these ice sheets than the climate models that many here criticize had predicted in the past. That means that we are going to see more sea level rise in the near term than the models had predicted.” -Michael Mann
Matt King, Professor, University of Tasmania:
This is a correct summary of the understanding of the science, and it is not in dispute.
Lauren Simkins, Assistant Professor, University of Virginia:
This is correct. The Greenland Ice Sheet is losing mass primarily due to increased surface melting due to rising atmospheric temperatures, whereas the majority of the margin of west Antarctic Ice Sheet is directly in contact with a warming ocean and has experienced increases in melting around the margin of the ice sheet that leads to ice shelf thinning and ice sheet retreat.
- Rignot et al (2008) Mass balance of the Greenland ice sheet from 1958 to 2007, Geophysical Research Letters
- Shepherd et al (2012) A reconciled estimate of ice-sheet mass balance, Science
“It’s been warming for hundreds of years! And we can’t explain all of that due to human causes..” -Judith Curry
Valerie Trouet, Associate Professor, University of Arizona:
The first sentence is a very general statement (what is “it”?), but I’m assuming Dr. Curry means Northern Hemisphere, Southern Hemisphere, or global average temperatures. None of these have been warming for hundreds of years, as she claims, but the available proxy data show a warming since approximately 1850 (see Fig. 5.7 in IPCC AR5 and Fig. 4b in PAGES2Kconsortium, 2013*, below). These results are based on paleoclimate data, not on models.
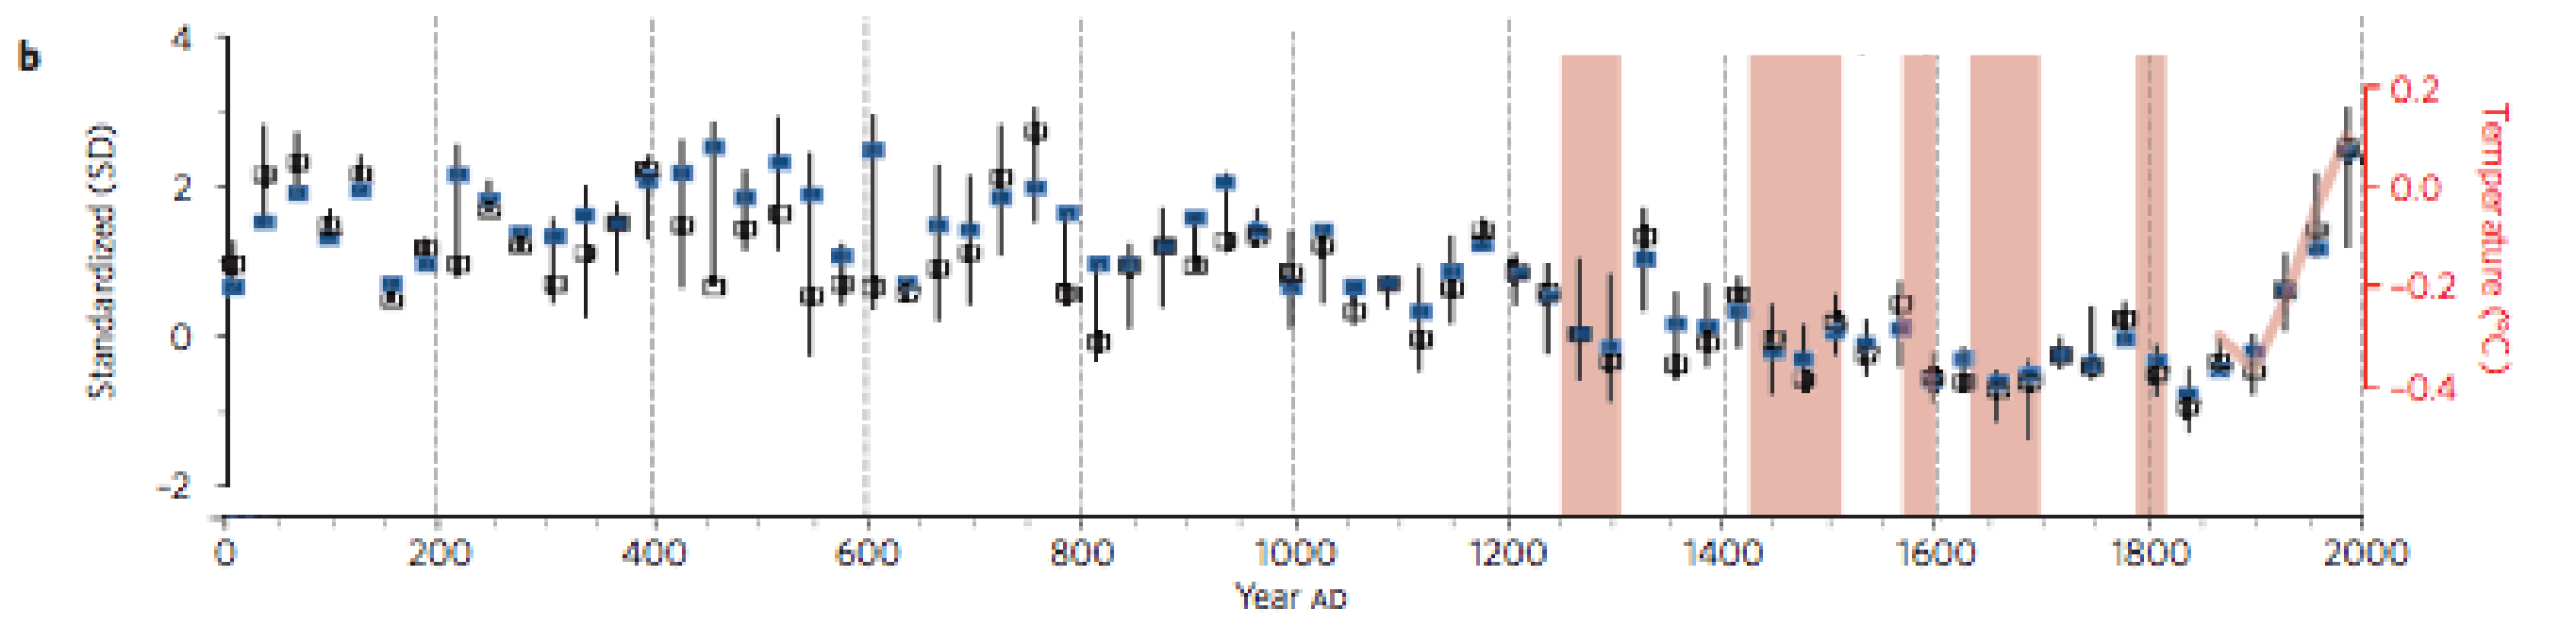
Figure – Composite temperature reconstructions: Standardized 30-year-mean temperatures averaged across all seven continental-scale regions. The red line is the 30-year-average annual global temperature from the HadCRUT4 instrumental time series relative to 1961–1990.
As to Dr. Curry’s 2nd statement, no one claims that all past warming is due to human causes. More important, however, is that the warming since 1850 cannot be explained by natural climate variability alone, without human causes. Only by including anthropogenic CO2 emissions as a forcing (in addition to the other external forcings) can models replicate the recent warming that is shown in the data.
- Pages 2k Consortium (2013) Continental-scale temperature variability during the past two millennia, Nature Geoscience
“I will put in the record an op-ed from The Wall Street Journal called “Keeping cool” about hot temperatures which points out that even though it is claimed that 2016 was the hottest year on record and 2015 was the hottest year on record before that 2014 the hottest year before that–all three instances the temperatures were within the margin of error and that in fact in 2014 NASA admitted that they were only 38 percent confident of that temperature. That is less than half.” -Rep. Lamar Smith (R-TX)
[The central claims of this op-ed were evaluated by scientists in a previous Climate Feedback analysis and found to be misleading.]
Andrea Dutton, Visiting Associate Professor, University of Wisconsin:
The op-ed is not peer reviewed literature and focuses on the question of which year is the hottest rather than on what is the trend in climate change. The NASA website clearly states that 15 of the 16 warmest years on record occurred since 2001, which demonstrates the importance of the long-term trend of increasing temperatures.
“I have demonstrated that we cannot predict the behavior of climate.” -John Christy
Timothy Osborn, Professor, University of East Anglia, and Director of Research, Climatic Research Unit:
This statement is incorrect: there are multiple examples where we have predicted the behaviour of climate, ranging from the seasonal cycle, the response to volcanic forcing, the warming of recent decades to some palaeoclimatic changes. See: Schmidt and Sherwood (2015)*
It is unfortunate that John Christy dramatically overstates the implications of his comparison between model simulations and tropical tropospheric temperatures to imply that we can make no predictions, because this is an important challenge for testing climate models from which we can learn much about climate response and about how to evaluate confidence in models. But his demonstration has flaws in its presentation (e.g. using too short a baseline period) and distracts from the key information about how models and observational trends differ in this region. See Santer et al. (2017)* for a comparison and an assessment of the implications — there are differences in simulated and observed warming trends in this part of the atmosphere but they are much less than Christy claims and don’t support a blanket assertion that “we cannot predict” climate.
- Schmidt and Sherwood (2015) A practical philosophy of complex climate modelling, European Journal for Philosophy of Science
- Santer et al (2017) Comparing Tropospheric Warming in Climate Models and Satellite Data, Journal of Climate
“There is little scientific basis in support of claims that extreme weather events – specifically, hurricanes, floods, drought, tornadoes – and their economic damage have increased in recent decades due to the emission of greenhouse gases. In fact, since 2013 the world and the United States have had a remarkable stretch of good fortune with respect to extreme weather, as compared to the past.” -Roger Pielke, Jr.
Kerry Emanuel, Professor Emeritus of Atmospheric Science, MIT:
Most of the published scientific work concerns the expected response of tropical cyclones to climate change and anticipates that such storms will become stronger and perhaps less frequent, but at a rate that should not be formally detectable until mid-century. Yet there is clear satellite-based evidence (e.g. Elsner et al., Nature, 2008; Kossin et al. J. Climate, 2013)* of increasing incidence of the strongest storms, as theory dating back to 1987 predicted.
- Elsner et al. (2008) The increasing intensity of the strongest tropical cyclones, Nature
- Kossin et al. (2013) Trend Analysis with a New Global Record of Tropical Cyclone Intensity, Journal of Climate
James Elsner, Professor, Florida State University:
While there is little scientific evidence that there will be more (or fewer) hurricanes or more hurricanes hitting the U.S., there is strong theoretical and statistical evidence that the strongest hurricanes are getting stronger as the oceans heat up due to global warming from the emission of greenhouse gases. In fact, there is statistical evidence that the magnitude of economic damage in the U.S. from hurricanes increases with rising ocean temperature.
- Elsner et al (2008) The increasing intensity of the strongest tropical cyclones, Nature
- Elsner (2007b) Granger causality and Atlantic hurricanes, Tellus A
- Jagger et al (2011) Climate and solar signals in property damage losses from hurricanes affecting the United States, Natural Hazards