

Misleading: The claim that scientists were caught “adjusting” sea level data misrepresents the process scientists use to account for potential errors in historical sea level data.
Cherry-picking: The claim highlights a single study, which has been formally refuted. The article does not include any of the research that has clearly shown rising sea levels over time.

REVIEW
CLAIM: Scientists were caught 'adjusting' sea level data to create false impression of rising oceans [...] Scientists have found that sea levels are stable - and have been for the entirety of the 20th century.
SUMMARY
The claim that sea levels have remained stable throughout the 20th century appeared in several outlets, including Breitbart and Signs of the Times, going viral in early 2020 with more than 800,000 views for the two articles on Facebook over the past three months. It contradicts numerous studies that clearly demonstrate a rise in global mean sea level[1], as you can see in the figure below. A recent IPCC report forecasts that global sea levels will continue to rise throughout the 21st century, with “unavoidable consequences for river runoff and local hazards.”
A recent study estimated that global mean sea level (GMSL) rose 1.3 ± 0.2 mm per year from 1902 to 2012[1]. However, sea level rise accelerated between 1993 to 2012, increasing at a rate of 3.1 ± 1.4 mm per year[1]. This acceleration was primarily driven by high rates of sea level rise in the Indian Ocean and Southern Pacific. These findings contrast with the claim that “sea levels are stable,” which was based on a single study from 2017 which analyzed sea level change near three cities, all located along the Indian Ocean (Aden, Karachi, and Mumbai).
The process of assessing historical changes in sea level and predicting future changes is complex and involves several key challenges, as described in Horton et al. (2018)[2]:
“First, regional and local sea-level changes vary substantially from the global mean[3]. Understanding regional variability is critical to both interpreting records of past changes and generating local projections for effective coastal risk management[3]. Second, uncertainty is pervasive in both records of past changes and in the physical and statistical modeling approaches used to project future changes[4], and it requires careful quantification and statistical analysis.”
Sea level changes differ across geographic locations for a variety of reasons. Wind and water density affect ocean circulation patterns, resulting in higher sea levels in some regions and lower sea levels in others. Land masses rise and sink over time as tectonic plates shift and ice sheets melt, reducing weight on the land’s surface. Because of this variation, a single geographic region cannot be used to draw conclusions about sea level stability on a global scale.
The claim that “scientists were caught ‘adjusting’ sea level data to create false impression of rising oceans” misrepresents approaches used by scientists to account for potential errors in historical sea level data. Instruments used to measure sea level, called tide gauges, may be replaced or moved to new locations over time. To calculate actual changes in sea level despite movements of the tide gauges, sea level data is compared to a stable benchmark at each sampling site. The process of adjusting data based on benchmarks is not arbitrary, as Thomas Frederikse explains in the reviewer comments below.
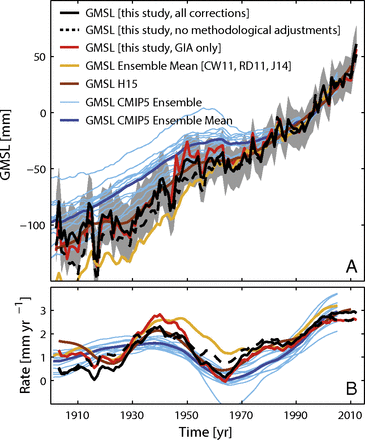
Figure – Global mean sea level (GMSL; A) and the rate of sea level change (B) based on 322 tide gauges measured from 1902-2012. Each color represents a different approach used to correct for movement of the tide gauges, uneven sampling across geographic regions, or the contribution of glacial ice sheet melt to sea level rise. From Dangendorf et al. (2017)[1].
SCIENTISTS’ FEEDBACK
Thomas Frederikse, Postdoctoral researcher, Jet Propulsion Laboratory/California Institute of Technology:
This claim is utterly false and has been formally refuted[5].
The idea is that tide-gauge measurements show sea level relative to the measuring device. That’d mean, if the device is lifted, or moved to another location, you’d get a jump in your time series.
To avoid these jumps, the Permanent Service for Mean Sea Level, the organization that collects a large global database of tide-gauge observations, requires that each record has a complete levelling history attached (called an “RLR diagram”). That means that surveyors regularly check the height of the tide gauge relative to a stable benchmark to ensure that the data shows sea-level changes and not instrument movements. When these movements occur, the levelling data is used to offset the impact of this movement. However, the original data without any adjustments for these instrument movements is also available.
Aden [in Yemen] is one of these records for which levelling data is available[6]. The station shows a clear rise in sea level of about 12 cm since ~1900. Now basically, the authors [of the refuted study] call this full levelling data “arbitrary”, come up with some random alternative “adjustments”, not backed by any reasonable argument, and voila, their manipulated sea-level data doesn’t show any sea-level rise anymore. Then they infer from their falsified data, based on this and two other records that global sea level is stable. Sea-level reconstructions, which typically include hundreds of tide-gauge records, unanimously show that sea level has risen by 15 to 25 cm since 1900.
Benjamin Horton, Professor, Earth Observatory of Singapore:
There is so much evidence from satellites, tide gauges, and geological records to show sea-level is rising[1]. For example, from my research, we have shown that the 20th-century rise was extraordinary in the context of the last three millennia—and the rise over the last two decades has been even faster[7].
Jonathan Gregory, Professor, University of Reading and UK Met Office Hadley Centre:
The paper by Parker and Ollier (2017) [that is cited in the claim] was rebutted by Rickards in the same journal later that year[5]. I understand from colleagues who are more familiar with this literature than me that Parker has published many other papers, some of them under another name of Boretti, containing incorrect analyses and misleading statements.
REFERENCES
- 1- Dangendorf et al. (2017) Reassessment of 20th Century Global Mean Sea Level Rise. PNAS.
- 2- Horton et al. (2018) Mapping Sea-Level Change in Time, Space, and Probability. Annual Review of Environment and Resources.
- 3- Milne et al. (2009) Identifying the causes of sea-level change. Nature Geoscience.
- 4- Church et al. (2013) Sea level change. In Climate Change 2013: The Physical Science Basis.
- 5- Rickards (2017) Comments on the Paper “Is the Sea Level Stable at Aden, Yemen?” by Albert Parker and Clifford D. Ollier in Earth Systems and Environment. Earth Systems and Environment.
- 6- Woodworth et al. (2009) Insight into Long Term Sea Level Change Based on New Tide Gauge Installations at Takoradi, Aden, and Karachi. International Hydrographic Review.
- 7- Kopp et al. (2016) Temperature-driven global sea-level variability in the Common Era. PNAS.