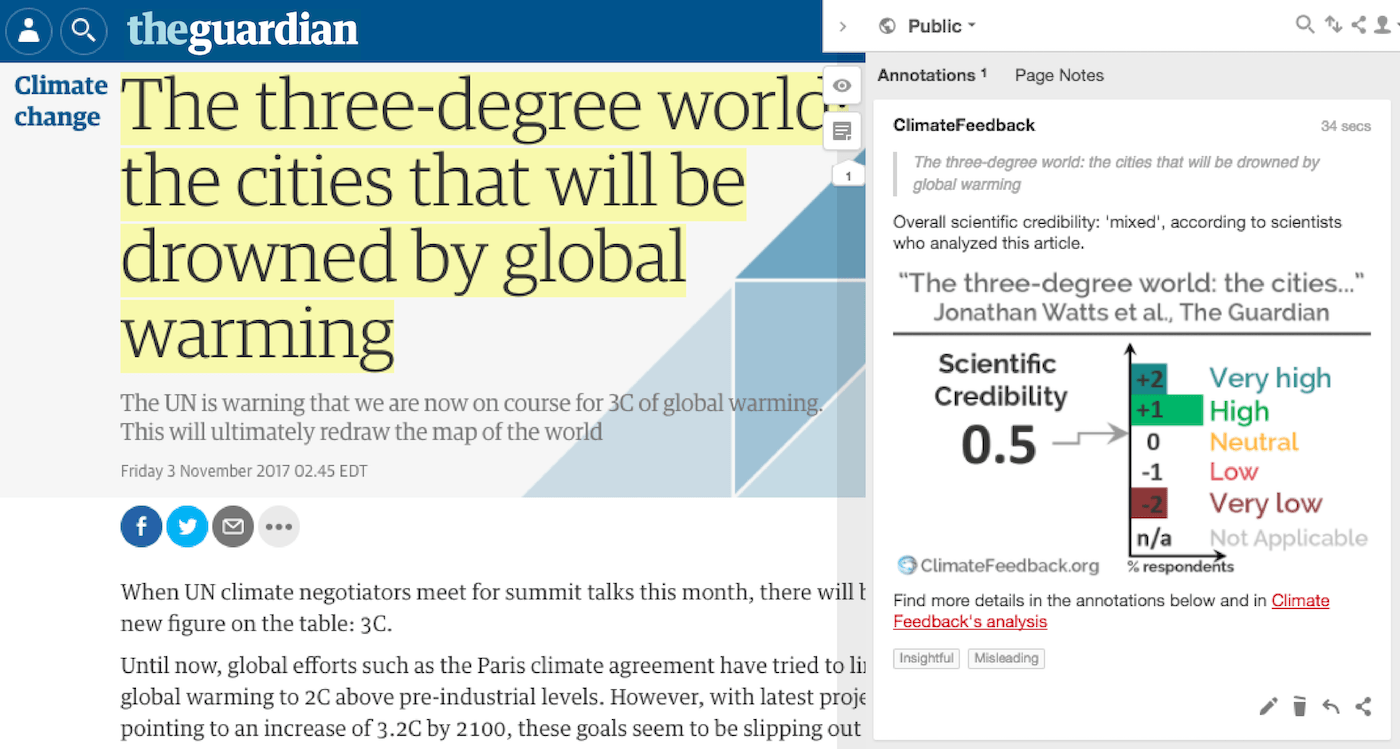
Four scientists analyzed the article and have mixed estimates of its overall scientific credibility. more about the credibility rating
A majority of reviewers tagged the article as: Insightful, Misleading.

SCIENTISTS’ FEEDBACK
SUMMARY
This story in The Guardian includes maps of, and reporting from, five coastal cities that will be affected by continued sea level rise. The story discusses the impact sea level rise will have on those cities, and what they are doing to prepare and adapt.
However, scientists who reviewed the story found that it fails to explain one very important thing to readers: nowhere is it explained that the magnitude of sea level rise shown (for a scenario in which the world warms by 3 °C) is the amount that would occur after the planet has had centuries to millennia to come into equilibrium with elevated temperatures. Readers are likely to assume that the story’s maps illustrate sea level rise that could occur before the end of the 21st century, but this is not the case.
See all the scientists’ annotations in context
UPDATE (15 November 2017): The Guardian article has been updated to include some explanation in an expandable box. It states, in part, “How quickly will oceans rise? It could take decades or centuries, but change will be locked in by a 3C temperature rise, which would extensively melt ice caps, shrink glaciers and thermally expand the oceans so many current coastlines and low-lying plains would be under sea level.”
REVIEWERS’ OVERALL FEEDBACK
These comments are the overall opinion of scientists on the article, they are substantiated by their knowledge in the field and by the content of the analysis in the annotations on the article.
Chris Roberts, Research Scientist, ECMWF/Met Office:
The methodology is appropriate, but the time scales involved should have been made clearer.
From the original report, “locked in” sea level is defined as “the sustained temperature increase or SLR that will ensue on a time scale of centuries to millennia”. This is not the same as the sea level rise that has already occurred if temperatures reach 3 °C, which is not obvious from the figures or text.
Andrew Shepherd, Professor, University of Leeds:
The Guardian article makes no mention of the timescale over which the “locked-in” sea level rise associated with a 3 °C climate warming would take place. The Climate Central report states that “the sea levels described could possibly, but with low probability, occur sooner than 200 years from now, or be reached as far as 2,000 years in the future”. Most readers would interpret this to mean there is a high probability that the timescale for the associated sea level rise would therefore fall between 200 and 2,000 years. This would have been a useful piece of information for the Guardian article to make clear. I think the Guardian article can be judged as misleading, because the only timescales mentioned are those of the warming and not the consequent sea level rise, and these are not matched.
Jeremy Fyke, Postdoctoral researcher, Los Alamos National Laboratory:
This article provides an excellent visual of an unfortunately very likely general future for humanity, in which sea level rise slowly inundates many coastal cities with accelerating impacts on a vast global population. It is very well presented visually, and does a great job of attempting to link global change (sea level rise) to impacts on individuals and communities—which is practically the whole point of worrying about climate change in the first place.
However, one major drawback of this article is that the magnitude and timescale of the sea level rises described in this report are not well explained. This probably leaves readers confused about, for example, what exact level of sea level rise is actually shown in the interactive plots, and over what timescale this could occur. This weakness in turn relates back to the methodology of the single study that underpins this work: Levermann et al, 2013*. In this work, they estimate the final sea level rise that occurs after several thousand years of climate response to greenhouse gas emissions. Unless I’m mistaken, it seems that this magnitude of sea level rise is what is being shown in these figures. (Though this is impossible to verify since no actual sea level rise numbers are printed, I think!) What is shown is not the sea level rise that will occur at year 2100 (as is sort of implied by the presence of figure 1). Thus it is a bit disingenuous to elicit reader reactions to sea level rise plots which represent scenarios that will practically not occur for thousands of years.
If we’re talking practical responses to sea level rise in present-day cities, we also need to talk about practically relevant sea level changes (not changes 2,000 years in the future, although these are of profound significance as well). Unfortunately, this article somewhat conflates millennial-scale sea level change with near-term (i.e., decadal to 2100-scale) responses.
Regardless, I continue to encourage this type of work by the Guardian to portray complex and critically societally relevant scientific data in a way that is immediately interpretable by the public.
- Levermann et al (2013) The multimillennial sea-level commitment of global warming, PNAS
Jan Lenaerts, Assistant Professor, University of Colorado, Boulder:
Well-documented and well-referenced article in The Guardian with innovative graphics and a gripping mix of science and personal stories of people living in vulnerable cities.
Notes:
[1] See the rating guidelines used for article evaluations.
[2] Each evaluation is independent. Scientists’ comments are all published at the same time.

